Topic: Financial Statement Analysis

Search 500 + past questions and counting.
Professional Bodies Filter
Program Filters
Subject Filters
More
Tags Filter
More
Check Box – Levels
Series Filter
More
Topics Filter
More

You are the Chief Finance Officer of LizOil Co. Ltd, a holding company with subsidiaries that have diversified interests. The company’s Board of Directors are interested in acquiring a new subsidiary in the Downstream Petroleum Sector. Two companies have been identified as potentials for the acquisitions: Addin Petroleum and Gyan Petroleum. The following are the summaries of their respective financial statements:

Statement of Profit or Loss for the year ended 30 September 2022

Statement of Financial Position as at 30 September 2022

Required:
a) Calculate the following ratios for each of the two companies: i) Net profit margin ii) Return on year-end capital employed iii) Quick ratio iv) Trade receivables’ collection period (in days) v) Gearing (debt over debt plus equity) vi) Interest cover (9 marks)

b) Write a report to the Chairperson of the board based on a comparable analysis of performance of both companies using the ratios computed in (a) above. (9 marks)
c) State TWO (2) limitations of ratios. (2 marks)

a) Computation of ratios
Note: Figures used are in thousands of Ghana Cedis.

(6 ratios @ 1.5 marks each = 9 marks)

Write a report to the Chairperson of the board based on a comparative analysis of the performance of both companies using the ratios computed in (a) above.

Report to the Chairperson
To: Chairperson of the Board
From: Chief Finance Officer
Subject: Assessment of Financial Statement of Acquisition Targets

Introduction
The investigation into the financial statements of Addin Petroleum and Gyan Petroleum should be viewed as preliminary in nature since a more detailed examination of the two companies will be required before any final decision is made regarding acquisition.

Assumptions
It is assumed that the two companies use similar accounting policies and that the statements of financial position are representative of the companies’ normal levels of trading.

Financial Performance
Analysis of the Statement of Profit or Loss of the two companies leads to the conclusion that Addin Petroleum has a better prospect on the basis of their performance for the year ended September 2022. Its operating profit before tax was more than twice that of Gyan Petroleum. As provided in the attached appendices, Addin Petroleum has performed better in terms of profitability ratios in all measures used (Gross Profit Margin, ROCE, and Net Profit Margin).

Working Capital Efficiency
Consistent with the financial performance analysis, Addin has a better financial position outlook when the specific ratios are analyzed together.
On Working Capital Efficiency, using the inventory turnover and receivables collection period ratios, Addin Petroleum’s records indicate a better liquidity position as compared to Gyan Petroleum. Gyan Petroleum’s receivables collection period shows signs of a lack of credit control policies and procedures. The quick ratio of Gyan Petroleum is also better than that of Addin, indicating a slightly better immediate liquidity position.

Gearing
Despite the comparatively good performance of Addin Petroleum on the basis of profitability, it is significantly more geared than Gyan Petroleum. Nonetheless, this risk is to some extent compensated by the better interest cover of six times as a result of investing in assets through debt financing.

Conclusion
The above analysis leads one to conclude that Addin Petroleum is a stronger and more profitable company. Without any further material information from additional investigations and the projected cost of acquisition, Addin Petroleum may be considered the better option. Gyan Petroleum, on the other hand, has prospects if its internal controls on working capital management are strengthened. It may be prudent to also consider Gyan if its cost of acquisition is significantly lower than Addin Petroleum.

(Marks are evenly spread using ticks = 9 marks)

As the Financial Controller of Shine Ltd, write a report to the Managing Director analyzing the performance of your company, comparing the results against that of Diamond Ltd (a key competitor) and against the industry average using the following measures:

  • Profitability
  • Liquidity
  • Gearing
  • Efficiency

To: Managing Director
From: Financial Controller
Subject: Performance Analysis for Shine Ltd – Year Ended 31 December 2016

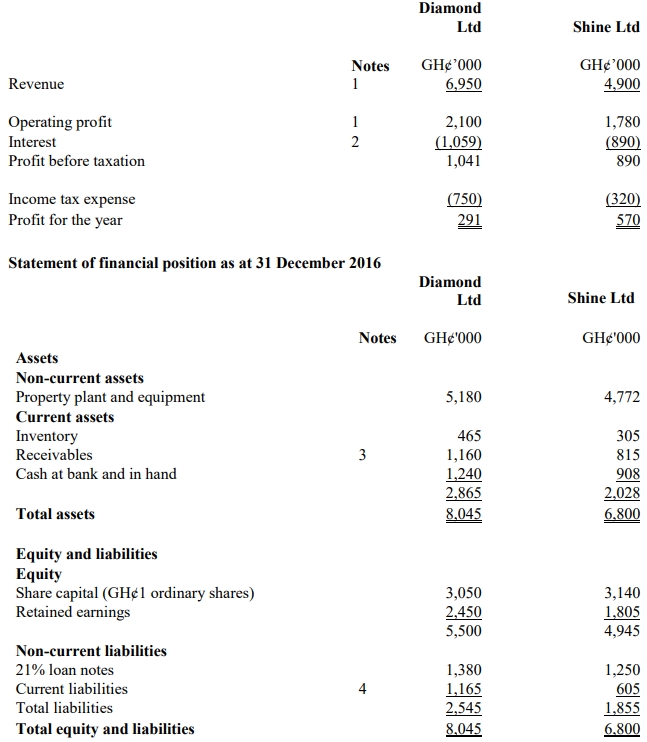
This report provides an analysis of the financial performance of Shine Ltd compared to Diamond Ltd, our key competitor, and the industry averages using the measures of profitability, liquidity, gearing, and efficiency.

1. Profitability

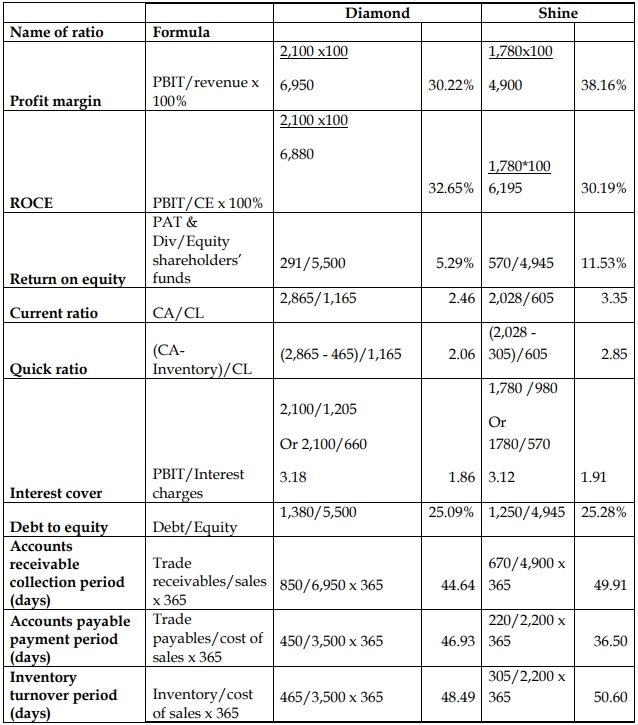
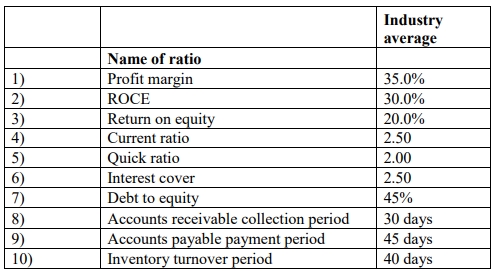
Profit Margin: Shine Ltd has a profit margin of 36.33%, which is significantly higher than Diamond Ltd’s 30.22% and also above the industry average of 35%. This indicates that Shine Ltd is more efficient in converting revenue into profit.

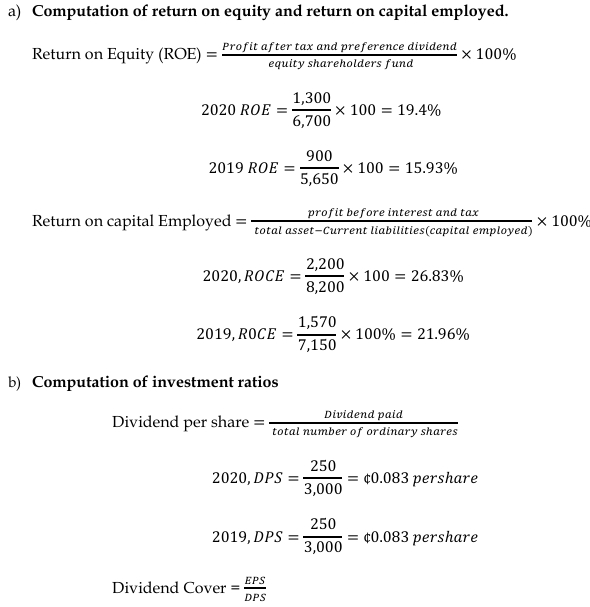
Return on Capital Employed (ROCE): Shine Ltd’s ROCE of 28.74% is slightly lower than Diamond Ltd’s 30.52% and below the industry average of 30%. This suggests that Shine Ltd is not utilizing its capital as effectively as Diamond Ltd in generating returns.

Return on Equity (ROE): Shine Ltd’s ROE of 11.53% is more than double that of Diamond Ltd (5.29%), but it is still significantly lower than the industry average of 20%. This indicates that while Shine Ltd is outperforming Diamond Ltd, there is room for improvement in generating returns for shareholders.

2. Liquidity

Current Ratio: Shine Ltd’s current ratio of 3.35 is better than Diamond Ltd’s 2.46 and higher than the industry average of 2.50. This suggests that Shine Ltd is in a stronger position to cover its short-term obligations.

Quick Ratio: Shine Ltd’s quick ratio of 2.85 is also superior to Diamond Ltd’s 2.06 and the industry average of 2.00. This further reinforces Shine Ltd’s strong liquidity position and its ability to meet immediate liabilities without relying on inventory sales.

3. Gearing

Interest Cover: Shine Ltd’s interest cover ratio is 2.00, which is similar to Diamond Ltd’s 1.98 and marginally below the industry average of 2.50. This indicates that Shine Ltd’s ability to meet interest payments is comparable to that of Diamond Ltd, but both are below industry standards, suggesting potential pressure in covering interest expenses.

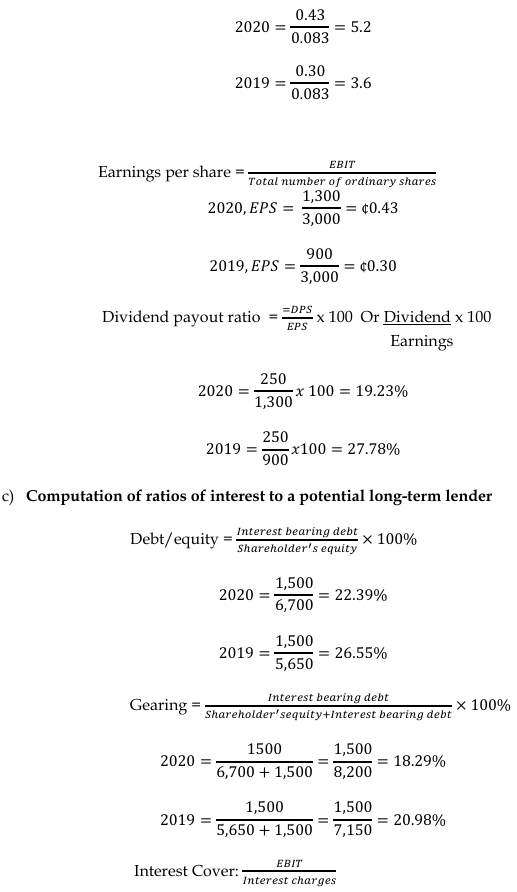
Debt to Equity Ratio: Shine Ltd’s debt to equity ratio of 25.28% is similar to Diamond Ltd’s 25.09% and much lower than the industry average of 45%. This indicates that Shine Ltd has a lower reliance on debt financing compared to the industry, which reduces financial risk.

4. Efficiency

Accounts Receivable Collection Period: Shine Ltd takes 49.91 days to collect receivables, which is longer than Diamond Ltd’s 44.64 days and the industry average of 30 days. This indicates that Shine Ltd is slower in collecting payments from customers, which could negatively impact cash flow.

Accounts Payable Payment Period: Shine Ltd takes 36.50 days to pay its suppliers, which is shorter than Diamond Ltd’s 46.93 days and the industry average of 45 days. This indicates that Shine Ltd is paying its suppliers faster than its competitor and the industry norm, which may affect its working capital management.

Inventory Turnover Period: Shine Ltd’s inventory turnover period is 50.60 days, slightly longer than Diamond Ltd’s 48.49 days and the industry average of 40 days. This indicates that Shine Ltd is holding inventory for a longer period, which could increase storage costs or risk of obsolescence.

Conclusion

Overall, Shine Ltd is performing well in terms of profitability and liquidity, outperforming Diamond Ltd and meeting or exceeding industry averages in several areas. However, there are concerns with the company’s efficiency, particularly in managing receivables and inventory. There is also a need to improve interest cover to reduce financial risk. Addressing these areas could further enhance Shine Ltd’s competitive position and financial health.

Signed:
Financial Controller

The following information has been extracted from the recently published accounts of Diamond Ltd and Shine Ltd.

Statement of Profit or Loss for the year ended 31 December 2016

The following are the latest industry average ratios:
Required:
Calculate comparable ratios (to two decimal places where appropriate) for the two companies. All calculations must be clearly shown.

Diamond Ltd and Shine Ltd

The following are the accounts of Bebebe Ltd (Bebebe), a company that manufactures playground equipment for the year ended 30 November 2020.

Statement of Comprehensive Income for the year ended 30 November:

Required:

a) Calculate, for both years, the return on equity and the return on capital employed. (4 marks)

b) Calculate, for both years, TWO (2) investment ratios to a potential investor. (4 marks)

c) Calculate, for both years, TWO (2) ratios of interest to a potential long-term lender. (4 marks)

d) Comment on the performance of Bebebe to a potential shareholder and lender using the ratios calculated above. (5 marks)

e) Explain THREE (3) weaknesses in these ratios.

(3 marks)

From the viewpoint of a potential shareholder who would be interested in the returns on their investment, ratios such as Return on Equity (ROE), Dividend per Share (DPS), and Earnings per Share (EPS) are crucial.

  • The ROE has improved from 15.93% in 2019 to 19.4% in 2020, indicating better utilization of shareholders’ funds.
  • EPS increased from GH¢0.30 to GH¢0.43, which could boost shareholder confidence as it suggests that the company is generating higher earnings per share.

From the viewpoint of a potential lender, the company’s Interest Cover ratio and Debt/Equity ratio would be key indicators of its ability to meet debt obligations:

  • Interest Cover has increased from 10.5 times in 2019 to 12.9 times in 2020, suggesting that the company is generating sufficient profits to cover its interest payments comfortably.
  • The Debt/Equity ratio decreased from 26.55% to 22.39%, indicating a decrease in financial risk as the company relies less on debt relative to equity.

e) Weaknesses in Ratios:

  1. Historical Nature:
    Ratios are based on historical financial information, and therefore may not reflect future performance.
  2. Comparability Issues:
    Different companies use different accounting policies, which can affect the comparability of ratios, such as using different depreciation methods.
  3. Industry Differences:
    Ratios may vary significantly across different industries, making it difficult to benchmark a company’s performance against others outside of its industry.

ANN Co is considering acquiring an interest in its competitor IB Co Ltd. The managing director of ANN Co has obtained the three most recent statements of financial position of IB Co Ltd as shown below:

IB Co Ltd – Statement of Financial Position as at 31st December:

2013 2014 2015
Non-current assets
Land and buildings 11,460 12,121 11,081
Plant and equipment 8,896 9,020 9,130
Total non-current assets 20,356 21,141 20,211
Current assets
Inventories 1,775 2,663 3,995
Trade receivables 1,440 2,260 3,164
Cash 50 53 55
Total current assets 3,265 4,976 7,214
Total assets 23,621 26,117 27,425
Equity
Share capital 8,000 8,000 8,000
Retained earnings 6,434 7,313 7,584
Total equity 14,434 15,313 15,584
Non-current liabilities
12% debentures (2015-2018) 5,000 5,000 5,000
Current liabilities
Trade payables 390 388 446
Bank 1,300 2,300 3,400
Income taxes payable 897 1,420 1,195
Dividend payable 1,600 1,696 1,800
Total current liabilities 4,187 5,804 6,841
Total equity and liabilities 23,621 26,117 27,425

Required:
Prepare a report for the managing director of ANN Co, commenting on the financial position of IB Co Ltd and highlighting any areas that require further investigation (using gearing and liquidity ratios only).

To: MD of ANN Co
From: Accountant
Date: XX.XX.XX
Subject: The Financial Position of IB Co Ltd

Introduction:
This report has been prepared on the basis of the three most recent financial statements of IB Co Ltd, covering the years 2013 to 2015 inclusive. The financial analysis focuses on two key areas: gearing and liquidity ratios.

Debt and Gearing:

  • The gearing ratio (debt to equity) measures the proportion of a company’s interest-bearing debt finance relative to its equity finance (shareholders’ funds).
  • For IB Co Ltd, the gearing ratio is calculated as follows:
    • 2013: (5,000 / 14,434) x 100 = 34.6%
    • 2014: (5,000 / 15,313) x 100 = 32%
    • 2015: (5,000 / 15,584) x 100 = 32%

Although we do not have the industry norm for comparison, IB Co Ltd’s gearing ratio appears reasonable. However, it is notable that the ratio has remained relatively stable over the three years, indicating no significant reduction in debt levels. The company continues to rely heavily on debt finance, which may expose it to financial risk, especially with rising interest rates or reduced profitability.

Liquidity Ratios:

  • The current ratio measures a company’s ability to meet its current liabilities out of current assets. It is calculated as follows:
    • 2013: 3,265 / 4,187 = 0.78:1
    • 2014: 4,976 / 5,804 = 0.86:1
    • 2015: 7,214 / 6,841 = 1.05:1

    Although the current ratio has improved over the period, IB Co Ltd’s ability to meet its short-term liabilities was inadequate in 2013 and 2014. A ratio of at least 1:1 is generally expected, and while IB Co reached this benchmark in 2015, the prior years were concerning.

  • The quick ratio (acid-test ratio) excludes inventories from current assets to assess the company’s ability to meet short-term liabilities using its most liquid assets:
    • 2013: (3,265 – 1,775) / 4,187 = 0.36:1
    • 2014: (4,976 – 2,663) / 5,804 = 0.40:1
    • 2015: (7,214 – 3,995) / 6,841 = 0.47:1

    The quick ratio is particularly concerning as it shows that IB Co Ltd would not be able to meet its current liabilities without relying on the sale of inventory. This is a liquidity risk, and the company’s reliance on inventory to cover short-term obligations should be closely monitored.

Conclusion:

IB Co Ltd’s financial position shows some improvements, particularly in the current ratio, but there are concerns about its liquidity as indicated by the quick ratio. It is recommended that further investigation is carried out to understand:

  • The nature of the company’s bank facilities and its reliance on short-term financing.
  • The inventory turnover period and whether the company’s reliance on inventories for liquidity is sustainable.
  • The terms of its debt, particularly the 12% debentures, and whether refinancing might be a possibility to reduce interest expenses.

Additionally, comparing IB Co Ltd’s ratios with industry averages would provide a better perspective on its financial health.

Workings – Calculation of Relevant Ratios:

The following information has been extracted from the Financial Statements of Mantemante Ltd.

Statement of Financial Position as at 31 December 2023

Additional information, including ratios such as Return on Capital Employed, Net Profit Margin, Asset Turnover, Gearing, etc., is also provided.

Required:
a) Compute the comparable ratios for Mantemante Ltd for the years 2022 and 2023.
(10 marks)
b) Write a report for the Board of Directors analyzing the performance of Mantemante Ltd with references to the ratios for the two years and industry averages.
(10 marks)

a) Computation of Ratios

S/N Ratio 2023 2022 Industry
1 Current Ratio = Current Assets / Current Liabilities 9,750 / 4,775 = 2.04:1 8,450 / 4,225 = 2.00:1 1.94:1
2 Return on Capital Employed = PBIT / Capital Employed * 100 (2,325 + 400) / (19,000 – 4,775) * 100 = 19.16% (1,600 + 300) / (15,600 – 4,225) * 100 = 16.70% 17.60%
3 Net Profit Margin = Profit / Revenue * 100 2,325 / 56,000 * 100 = 4.04% 1,600 / 48,750 * 100 = 3.28% 3.95%
4 Total Asset Turnover = Revenue / Total Assets 56,000 / 19,000 = 2.95:1 48,750 / 15,600 = 3.13:1 3.26:1
5 Acid Test Ratio = (Current Assets – Inventories) / Current Liabilities (9,750 – 3,200) / 4,775 = 1.37:1 (8,450 – 2,450) / 4,225 = 1.42:1 1.15:1
6 Gross Profit Margin = Gross Profit / Revenue * 100 (56,000 – 42,300) / 56,000 * 100 = 24.46% (48,750 – 34,125) / 48,750 * 100 = 30.00% 33.42%
7 Receivables Collection Period = Receivables / Revenue * 365 6,550 / 56,000 * 365 = 43 days 6,000 / 48,750 * 365 = 45 days 48 days
8 Payables Payment Period = Payables / Cost of Sales * 365 4,075 / 42,300 * 365 = 35 days 3,550 / 34,125 * 365 = 40 days 42 days
9 Inventories Turnover = Cost of Sales / Inventories 42,300 / 3,200 = 13.2 times 34,125 / 2,450 = 13.93 times 16.7 times
10 Gearing = Non-Current Liabilities / (Total Assets – Current Liabilities) * 100 4,000 / (19,000 – 4,775) * 100 = 28.12% 3,000 / (15,600 – 4,225) * 100 = 26.37% 34.21%

(1 mark for each ratio = 10 marks)

b) Report to the Board of Directors

To: Board of Directors
From: Management Accountant
Subject: Analysis of Performance of Mantemante Ltd

Introduction
This report provides an analysis of the performance of Mantemante Ltd for the year ended 31 December 2023, compared to the year 2022 and the industry averages. The analysis will focus on profitability, liquidity, efficiency, and gearing ratios.

Profitability
Return on Capital Employed (ROCE) has improved significantly, moving from 16.70% in 2022 to 19.16% in 2023, surpassing the industry average of 17.60%. This suggests better utilization of capital. Similarly, the Net Profit Margin has increased to 4.04%, slightly above the industry average of 3.95%, indicating enhanced profitability. However, the Gross Profit Margin has dropped from 30% to 24.46%, below the industry average of 33.42%, which may suggest higher costs or pricing pressures.

Liquidity
The Current Ratio has improved slightly to 2.04:1, comfortably above the industry average of 1.94:1, indicating that the company can cover its short-term liabilities. The Acid Test Ratio, however, has decreased marginally to 1.37:1 but remains above the industry average of 1.15:1, indicating no immediate liquidity concerns.

Efficiency
Receivables Collection Period has remained relatively stable at 43 days, slightly better than the industry average of 48 days. The Payables Payment Period has shortened to 35 days, below the industry average of 42 days, suggesting quicker payments to suppliers, which might need review to improve cash flow management. Inventories Turnover has decreased slightly but remains lower than the industry average, indicating potential inefficiencies in managing stock levels.

Gearing
The company’s Gearing Ratio has increased marginally but remains lower than the industry average, suggesting the company has room to increase its debt if necessary.

Conclusion
Mantemante Ltd has shown improvements in profitability and liquidity over the past year. However, the decline in Gross Profit Margin and inventories turnover indicates potential areas for improvement. The company’s gearing remains conservative, leaving room for strategic financing if required.

(Total: 20 marks)

Krofrom Ltd is also a listed company operating in the manufacturing sector in Ghana. The non-current asset turnover ratio of Krofrom Ltd for the year 2015 is 1.3.

Required:
Compute the non-current asset turnover ratio for Ashtown Ltd and explain TWO reasons why these ratios may not provide a good comparison of the efficiency of the entities.

Non-Current Asset Turnover Ratio for Ashtown Ltd:

Comparison:

  • Krofrom Ltd’s Non-Current Asset Turnover Ratio: 1.3 times
  • Ashtown Ltd’s Non-Current Asset Turnover Ratio: 1.52 times

Ashtown Ltd appears to utilize its non-current assets more efficiently than Krofrom Ltd, given its higher asset turnover ratio. However, there are reasons why these ratios may not provide a good comparison:

  1. Asset Age or Depreciation Differences:
    • The non-current assets of one company (e.g., Krofrom Ltd) may be older and more depreciated, resulting in a lower carrying amount and, therefore, a lower turnover ratio.
    • On the other hand, if Ashtown Ltd has recently invested in newer assets, its higher asset turnover could be artificially inflated.
  2. Revaluation of Assets:
    • If either company has revalued its assets (for instance, if Ashtown Ltd has revalued its property, plant, and equipment), this would increase the carrying amount of non-current assets, potentially lowering the asset turnover ratio.
    • Conversely, the lack of revaluation in one company could make their assets appear undervalued compared to their true economic worth.

You are a private consultant for Ashtown Ltd, a listed company in Ghana operating in the manufacturing sector. Below is a Statement of Financial Position and a summarized statement of changes in equity with comparatives for the year ended 31 December 2015.

Statement of Financial Position as at 31 December 2015:

Required:
Prepare a report and address it to the Chief Executive Officer, analyzing the financial performance and financial position of Ashtown Ltd based on the industry ratios above for the years 2014 and 2015.

REPORT
To: Chief Executive Officer
From: Consultant
Date: 31 December 2015
Subject: Financial Performance and Financial Position of Ashtown Ltd for the year ending 2015

As requested, I have analyzed the financial performance and financial position of Ashtown Ltd. My analysis is based on the Statement of Financial Position, the summarized statement of changes in equity, and the additional information given. A number of key measures have been calculated and these are set out in the attached appendix.

Financial Performance

Gross Profit Margin:
Gross profit margin measures how efficiently Ashtown Ltd generates profit from its sales after considering the cost of sales. For 2015, the gross profit margin was 40%, an improvement from 28.77% in 2014, and is higher than the industry average of 32%. This indicates better cost management or an increase in pricing.

Net Profit Margin:
Net profit margin reflects how much profit the company retains from its revenue after all expenses. In 2015, Ashtown Ltd’s net profit margin was 24.93%, which is a slight decrease from 26.94% in 2014 but still above the industry average of 20%. The company has performed better than its peers in this regard.

Return on Capital Employed (ROCE):
ROCE measures how efficiently Ashtown Ltd uses its capital to generate profit. The ROCE in 2015 was 28.88%, an increase from 19.80% in 2014, and is higher than the industry average of 22%. This indicates that the company is making efficient use of its capital and generating strong returns.

Financial Position

Current Ratio:
The current ratio measures liquidity and the ability of Ashtown Ltd to meet short-term obligations. In 2015, Ashtown Ltd’s current ratio was 2.36 times, an improvement from 1.84 times in 2014, and above the industry average of 2.0 times. This suggests that the company has strong short-term liquidity and is in a good position to cover its current liabilities.

Debt to Equity Ratio:
This ratio measures the financial leverage of the company, showing how much debt is used compared to equity. In 2015, Ashtown Ltd’s debt to equity ratio was 19.2%, down from 43.9% in 2014, which is lower than the industry average of 50%. This reflects a lower reliance on debt and improved financial stability.

Conclusion

In conclusion, Ashtown Ltd’s financial performance in 2015 has improved, especially in terms of gross profit margin and ROCE, both of which are above industry averages. The company’s liquidity and solvency positions are also favorable, with a strong current ratio and a reduced debt to equity ratio. However, the company should continue monitoring its operational costs to prevent further decline in net profit margin.

Appendix:

2015 Ratios:

Suame Ltd is a listed telecommunication company which prepares its financial statements for the year ended 31 October 2015 in accordance with IFRS. The financial statements are due to be authorised for issue on 15 January 2016.

  • i) Suame Ltd holds an investment in the shares of a listed company, Asafo Ltd. During November 2015 there was a material fall in the value of Asafo Ltd’s shares. Analysts attribute the fall in value principally to a fraud dating back to December 2014 that was discovered by Asafo Ltd’s management and announced publicly in November 2015.
  • ii) In December 2015, the directors of Suame Ltd publicly announced a plan to reduce the workforce by 10% as a result of worsening economic conditions.

Required:
Discuss the effects of each of the above items on the financial statements of Suame Ltd for the year ended 31 October 2015 in accordance with IAS 10 Events after the Reporting Period.

i) Fraud at Asafo Ltd:

  • The fraud at Asafo Ltd was discovered after Suame Ltd’s reporting date of 31 October 2015.
  • This is a non-adjusting event under IAS 10 because the fraud was not known before the reporting date, and the fall in share value occurred after the reporting date.
  • The event does not affect conditions that existed as of 31 October 2015, so no adjustments should be made to the financial statements.
  • However, disclosure of the event should be made in the notes to the financial statements, explaining the nature of the event and the estimated financial impact.

ii) Workforce Reduction:

  • The plan to reduce the workforce was announced in December 2015, after the reporting period.
  • This is also a non-adjusting event under IAS 10, as there was no obligation to restructure at the reporting date (31 October 2015).
  • While no provision should be recognised in the financial statements, the event should be disclosed in the notes, detailing the nature of the event and any expected financial effect.

(4 marks)