Subject: INTRODUCTION TO MANAGEMENT ACCOUNTING

Search 500 + past questions and counting.
Professional Bodies Filter
Program Filters
Subject Filters
More
Tags Filter
More
Check Box – Levels
Series Filter
More
Topics Filter
More

a) Most organisations use time as a basis to reward their employees, hence they pay their staff on a time basis using clock-in devices. Employers are therefore likely to pay for attendance instead of tasks performed. Accountants believe that employees should be rewarded based on tasks, however, not all tasks can easily be rewarded on a time basis.

Required:
i) State THREE (3) factors that should be considered when deciding to use a time-based reward system. (6 marks)
ii) State THREE (3) measures that can be put in place to ensure that employees do not only report for work but execute their tasks as required. (6 marks)

b) State THREE (3) challenges management may face in implementing group bonus schemes. (3 marks)

c) Standard costing among other advantages is used for performance measurement and control reporting.

Required:
Explain how the above uses of standard costing are measured. (5 marks)

a) i) Factors to consider in deciding to use a time-based reward system:

  1. Nature of the Job: When the job is difficult to quantify in terms of output, such as creative or intellectual work.
  2. Quality Over Quantity: When the quality of work is more important than the quantity, ensuring meticulous and error-free output.
  3. Teamwork Requirement: When tasks are performed by several individuals collaboratively, making it hard to measure individual contributions separately. (Any 3 points @ 2 marks each = 6 marks)

ii) Measures to put in place to ensure employees work effectively:

  1. Supervision: Regular monitoring and supervision to ensure tasks are being completed as required.
  2. Task Assignment: Providing additional tasks when previous ones are completed to keep employees engaged and productive.
  3. Incentives: Offering incentives for high performers to motivate employees to complete their tasks efficiently. (Any 3 points @ 2 marks each = 6 marks)

b) Challenges of implementing group bonus schemes:

  1. Distribution Issues: Problems in fairly distributing the bonus among group members.
  2. Identifying High Performers: Difficulty in recognizing individual high performers within the group.
  3. Task Separation: Challenges in separating tasks to determine individual contributions.
  4. Demotivation of Hard Workers: Potential demotivation of hardworking employees if lazy workers unduly qualify for bonuses. (Any 3 points @ 1 mark each = 3 marks)

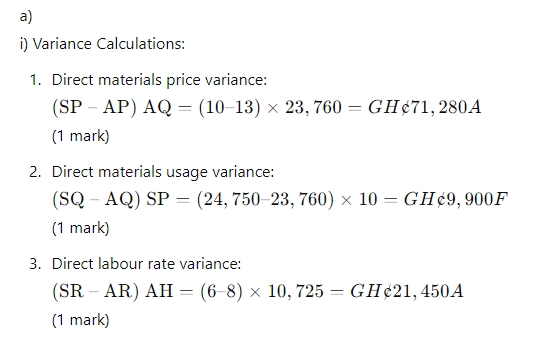
c) Uses of standard costing for performance measurement and control reporting:

  1. Performance Measurement: Variances between standard costs (expected costs) and actual costs are measured regularly. These variances help identify areas of good performance or poor performance. Positive variances indicate efficient performance, while negative variances highlight areas needing improvement. (2.5 marks)
  2. Control Reporting: Variance analysis helps management identify significant deviations from expected performance. If actual results significantly differ from standard costs, management investigates the causes and implements corrective actions to control and improve operations. This ensures that operations are aligned with organizational goals. (2.5 marks)

a) Magawa Ltd operates a standard variables costing system and manufactures a single product called “Magic Touch”.

The following quantities, costs and prices data have been extracted for the period just ended March 31, 2021 in respect of Magic Touch:

Standard cost card:

GH¢
Direct materials 15g at GH¢10/g = 150
Direct labour 8 hours at GH¢6/hour = 48
Variable overheads 8 hours at GH¢4/hour = 32
Standard contribution 25
Standard selling price per unit 255

Budgeted production units: 1,500

Actual results for the period ended March 31, 2021 were as follows:

Production and sales units 1,650
Selling price per unit GH¢278
Direct materials used 23,760g
Direct materials costs GH¢308,880
Direct labour hours worked 10,725
Direct labour costs GH¢85,800
Variable overheads GH¢68,000

Required: i) Compute the following variances for Magawa Ltd for the period ended March 31, 2021:

  1. Direct materials price variance. (1 mark)
  2. Direct materials usage variance. (1 mark)
  3. Direct labour rate variance. (1 mark)
  4. State ONE (1) possible reason for the material price variance calculated. (1 mark)
  5. State ONE (1) possible reason for the labour rate variance calculated. (1 mark)

b) The Valuation Department of a large firm of surveyors wishes to develop a method of predicting its total costs in a period. The following past costs and activity levels have been recorded.

Period Number of Valuations (V) Total Cost (TC) GH¢
1 420 82,200
2 515 90,275
3 425 82,900
4 500 90,000

Required: i) Derive a formula for the total cost model for a period. (4 marks) ii) Evaluate the usefulness of the high-low method. (4 marks)

c) The trend line on its own is not sufficient to make forecasts for the future. Estimates of the size of the ‘seasonal’ variation for each of the different seasons are needed. The seasonal variation is then used to adjust a forecast trend.

Required: Explain TWO (2) models used to estimate seasonal variations. (7 marks)

  1. Possible reason for the material price variance: Increase in raw material prices due to inflation or shortage of materials. (1 mark)
  2. Possible reason for the labour rate variance: Increase in wage rates due to higher demand for skilled labour or overtime payments. (1 mark)

b) i) Total cost model using high-low method:

Period V TC (GH¢)
2 515 90,275
1 420 82,200

Change in TC = 90,275 – 82,200 = 8,075 Change in V = 515 – 420 = 95 Variable cost per valuation = 8,075 / 95 = 85

Fixed cost = TC – (VC × V) Using Period 2: Fixed cost = 90,275 – (85 × 515) = 46,000

Total cost model: TC = 46,000 + 85V (4 marks)

ii) Usefulness of the high-low method:

  • Simple and Easy: The high-low method is straightforward and easy to apply for estimating fixed and variable costs.
  • Limited Data Requirement: Requires only two data points, making it useful when limited data is available.
  • Quick Estimates: Provides quick estimates of cost behavior which can be useful for preliminary analysis.
  • Potential Issues: However, it ignores data between the high and low points, potentially leading to inaccuracies if those points are not representative of normal operations. Historical data used may not reflect current conditions. (4 marks)

c) Models used to estimate seasonal variations:

  1. Additive Model:
    • Assumes that seasonal variations above and below the trend line in each cycle add up to zero.
    • Steps:
      • Calculate the difference between the moving average value and the actual historical figure for each time period.
      • Group these seasonal variations into different seasons (e.g., days of the week, months, or quarters).
      • Calculate the average of these seasonal variations for each season.
      • If the total seasonal variations for the cycle do not add up to zero, spread the difference evenly across each season.
      • The adjusted figure is the seasonal variation. (3.5 marks)
  2. Proportional (Multiplicative) Model:
    • Expresses the actual value in each season as a proportion of the trend line value.
    • Steps:
      • Calculate seasonal variations for each time period by dividing the actual data by the corresponding moving average or trend line value.
      • Sum of the proportions for each time period must add up to 1 (or the sum of proportions for quarterly data must sum to 4).
      • If the sum does not match, spread the difference evenly over each quarter to adjust the proportions. (3.5 marks)

a) Frankadua Furniture Works located at Bomaa in the Ahafo Region has a rough estimate of the materials and labour cost of a set of living room furniture. It is expected that 8 cubic metres of timber, 6 cubic metres of foam and 12 square metres of fabric can be used. Glue, screws and other accessories will also cost GH¢80.

The Carpenters who will do the cutting, joining and finishing will use 35 hours. Since the company is fairly new, it will engage a tailor to sew the fabric to fit the sizes of the units of the chairs. For each set the tailor will charge GH¢150. Labour is paid at GH¢12 per hour plus a premium of GH¢5 per hour when the job requires more than 20 hours.

Timber is priced at GH¢25 per cubic metre, foam is GH¢20 per cubic metre while the fabric is GH¢15 per square metre. The Accountant has estimated overhead absorption rate of 20% on direct material cost.

Required:
i) Determine the prime cost of a set of living room furniture. (10 marks)
ii) Determine the full cost of a set of living room furniture. (5 marks)

b) Kempion Breweries Ltd has just commenced business in the alcoholic beverage sector of Ghana producing a local gin called Pitoo and is desirous of having a good grasp of its costs for product costing, valuation and pricing purposes.

Required:
State FOUR (4) features of a process costing system to be used by Kempion Breweries to arrive at the total cost of Pitoo. (5 marks)

a) i) Prime cost of the set of furniture:

Description Calculation GH¢
Timber 8 cubic metres x GH¢25/m³ 200
Foam 6 cubic metres x GH¢20/m³ 120
Fabric 12 square metres x GH¢15/m² 180
Glue, screws, accessories 80
Direct labour 35 hours x GH¢12/hour + (15 hours x GH¢5/hour premium) 420
Direct expenses Tailor charges 150
Total Prime Cost 1,150

(10 marks)

ii) Full cost:

Description Calculation GH¢
Prime cost From above 1,150
Overhead 20% of direct material cost (GH¢500) 100
Total Full Cost 1,250

(5 marks)

b) Features of a process costing system:

  1. Products are produced in mass quantities.
  2. Production is done in a sequential manner such that the output of one process becomes the input for a subsequent process.
  3. Product costs per unit are obtained through averaging.
  4. There are usually losses associated with process costing in the form of normal and sometimes abnormal losses.
  5. There is usually work-in-progress (WIP) in process costing that requires valuation.
  6. Valuing equivalent units of partly finished units may arise.
  7. Valuing joint and by-products may also arise in process costing. (Any 4 points @ 1.25 marks each = 5 marks)

a) Dampare Ltd manufactures three products namely A, B, and C. The information given below relates to the month of November 2020.

Product Quantity (Units) Price/Unit (GH¢)
Sales:
A 1,200 80
B 2,400 96
C 1,800 112

Materials used in company’s Products:

Material MA MB MC
Unit cost GH¢3 GH¢5 GH¢8
Quantity used in: MA (Units) MB (Units) MC (Units)
Product A 5 3 1
Product B 4 4 3
Product C 3 2 2

Finished Stock:

Product A (Units) Product B (Units) Product C (Units)
Opening stock 1,200 1,800
Closing stock 1,320 1,980

Material Stock:

Material MA (Units) MB (Units) MC (Units)
Opening stock 31,200 24,000 14,400
Closing stock 37,440 28,800 17,280

Required: Prepare the following functional budget for the month of November 2020 for: i) Sales in quantity and value, including total value ii) Production quantities iii) Material usage in quantities iv) Material purchases in quantities and value, including total value. (15 marks)

b) Principal budget factor is such an important factor in the budgetary control process. It is essential to identify the principal budget factor before the preparation of budgets.

Required: i) Explain the term “Principal budget factor” as used in budgetary control. (2 marks) ii) Identify THREE (3) examples of Principal budget factor from financial institution. (3 marks)

a) i) Sales quantity and value budget:

Product Quantity (Units) Price/Unit (GH¢) Sales Value (GH¢)
A 1,200 80 96,000
B 2,400 96 230,400
C 1,800 112 201,600
Total 528,000

ii) Production quantity budget:

Product Sales Quantity (Units) Add Closing Stock (Units) Total (Units) Less Opening Stock (Units) Units to be Produced
A 1,200 1,320 2,520 1,200 1,320
B 2,400 1,980 4,380 1,800 2,580
C 1,800 660 2,460 600 1,860

iii) Material Usage Budget (quantities):

Product Production Quantity MA (Units) MB (Units) MC (Units)
A 1,320 6,600 3,960 1,320
B 2,580 10,320 10,320 7,740
C 1,860 5,580 3,720 3,720
Total 22,500 18,000 12,780

iv) Material Purchases Budget (quantities and value):

Material MA (Units) MB (Units) MC (Units) Total (Units)
Usage 22,500 18,000 12,780
Add Closing Stock 37,440 28,800 17,280
Total 59,940 46,800 30,060
Less Opening Stock 31,200 24,000 14,400
Purchases 28,740 22,800 15,660
Price/Unit GH¢3 GH¢5 GH¢8
Value (GH¢) 86,220 114,000 125,280 325,500

(15 marks evenly spread)

b) i) The principal budget factor is also known as the limiting factor or key factor. It is defined as the factor which at a particular time, or over a period, will limit the activities of an undertaking. The limiting factor is usually the level of demand for the products or services of the undertaking but it could be a shortage of one of the productive resources. (2 marks)

ii) Examples of Principal budget factor from financial institution include:

  1. Skilled labour
  2. Level of ICT
  3. High interest rate
  4. Reserve ratios. (Any 3 points @ 1 mark each = 3 marks)

a) A large manufacturing company is investigating the cost of sickness amongst production workers who the company has employed for more than one year. The following regression equation, based on a random sample of 50 for such production workers, was derived for 2018:

y=15.6−1.2xy = 15.6 – 1.2x

where yy represents the number of days absent in a year because of sickness and xx represents the number of years’ employment with the company.

Required: i) Explain the meaning of each component of the regression equation. (2 marks)
ii) Predict the number of days of absence through sickness to be expected of an employee who has been with the company for eight years. (2 marks)
iii) Explain TWO (2) limitations or problems of using this equation in practice. (4 marks)

b) A statistician is carrying out an analysis of a company’s production output. The output varies according to the year’s season, and, from the data, she has calculated the following seasonal variations in units of production:

QUARTER 1 2 3 4
Year 1 +11.2 +23.5
Year 2 -9.8 -28.1 +12.5 +23.7
Year 3 -7.4 -26.3 +11.7

Required: i) Calculate and explain the average quarterly variation for each quarter. (5 marks)
ii) If the trend output in the 4th Quarter of Year 3 is expected to be 10,536 units, what is the forecast output? (2 marks)

c) KK Ltd operates a standard absorption costing system and has provided the following costs data in relation to its prime product, Qwikpass:

Standard Cost Card:

GH¢
Direct Material 4kg @ GH¢3/kg 12
Direct Labour 3hrs @ GH¢5/hr 15
Variable Overheads 3hrs @ GH¢3/hr 9
Fixed Overheads 3hrs @ GH¢2 6
Total Cost per Unit 42

Budgeted Units: 6,000

Actual Results:

GH¢
Units produced 6,400
Direct Materials Purchased and used 32,000kg 144,000
Direct Labour 30,720hrs 199,680
Variable Overheads 138,240
Fixed Overheads 45,000
Total costs 526,920

Required: i) Compute the Variable Overheads Expenditure Variance. (1 mark)
ii) Compute the Fixed Overheads Expenditure Variance. (2 marks)
iii) Compute the Fixed Overheads Volume Variance. (2 marks)

a)
i) We have a negative correlation here, as shown by the negative coefficient of xx in the regression line. As the number of years employed with the company rises, the number of days absent in a year through sickness falls.
y=15.6−1.2xy = 15.6 – 1.2x
The 15.6 represents the number of days of absence through sickness that an employee with zero years’ service is expected to suffer, so it is the number of days that an employee will need off through sickness in their first year of employment.
The -1.2 represents the gradient of the regression line, meaning that for each extra year’s service with the company, an employee will take 1.2 fewer days off sick per year. (2 marks)

ii) An employee who has been with the company for eight years is expected to require six days of sick leave per year. (2 marks)

iii) Limitations and problems of using the equation in practice:

  • The regression line approach presupposes a linear relationship between the two variables: a sample of 50 workers has given us quite a strong correlation, but a strict linear relationship seems unlikely.
  • A linear relationship may hold well within a small relevant range of data within which the equation may be useful in practice. But extrapolating outside the range will lead to serious inaccuracies. Thus, the equation would predict that an employee with more than 15.3/1.2 = 13 years’ service would have less than zero sick leave.
  • If we use the equation to predict the future, we will use historical data to forecast the future, which is always risky.
  • The regression line shows the expected number of days sick for a given employment period. But it is unlikely that all categories of workers will experience the same sickness pattern. The equation would be most useful if there were many employees all doing the same job in the same work conditions. (4 marks)

b)
i) Average Quarterly Variation Calculation:

QUARTER 1 2 3 4 TOTAL
Year 1 +11.2 +23.5
Year 2 -9.8 -28.1 +12.5 +23.7
Year 3 -7.4 -26.3 +11.7
Average variation -8.6 -27.2 +11.8 +23.6 -0.4
Adjust total variation to nil +0.1 +0.1 +0.1 +0.1 +0.4
Estimated seasonal variation -8.5 -27.1 +11.9 +23.7 0.0

Seasonal variations are short-term fluctuations in recorded values, due to different circumstances which affect results at different times of the year, on different days of the week, at different times of day, or whatever. For example, sales of ice cream will be higher in summer than in winter.
In this data, the highest output can be expected to be in the winter and the lowest in the summer. (5 marks)

ii) Forecast output = Trend + Seasonal variation
= 10,536 + 23.7
= 10,559.7 units (2 marks)

c)
i) Variable Overheads Expenditure Variance:

GH¢
30,720 hours should have cost (30,720 x 3) 92,160
But did cost 138,240
Variance 46,080 A

ii) Fixed Overheads Expenditure Variance:

GH¢
Budgeted Overheads (6,000 x GH¢6) 36,000
Actual Overheads 45,000
Variance 9,000 A

iii) Fixed Overheads Volume Variance:

GH¢
Budgeted production units 6,000
Actual production units 6,400
Variance (400 F @ cost/unit GH¢6) GH¢2,400 F

a) Asase Aban Ltd pays some of the employees on a time basis but is subject to a monthly minimum wage of GH¢800 as directed by the Government of Ghana. For one of the months, the following data were extracted from the timesheet of the company:

SRN Name Staff Number Number of hours
1 Kwame Sarfo K00324 262
2 Ajoa Mansa A00225 240
3 Salomy Adiku S00552 180
4 Joseph Asiedu J00654 332
5 Thomas Tinge T00724 204

The hourly rate was GH¢4.00, the minimum hours to be worked by each staff beyond which overtime can be paid is 224 per month. All overtime attracts a premium of GH¢1.50 per hour.

Required: i) Calculate the direct labour cost for the month. (8 marks) ii) Calculate the total indirect labour cost for the month. (2 marks)

b) Most businesses overlook their actual inventory cost, but in reality, the inventory price is more than its purchase price. It is because it includes the cost of ordering, as well as the cost of storing and maintaining until sales happen. Therefore, for assessing inventory value, every business must consider carrying or holding cost and ordering cost, together with the purchase price.

Required: i) State TWO (2) examples of inventory ordering costs. (2 marks) ii) State THREE (3) examples of inventory holding costs. (3 marks)

c) Explain TWO (2) uses of standard costing. (5 marks)


a) i) Calculation of direct labour cost for the month:

Name Hours Worked Basic Pay (GH¢) Overtime Hours Overtime Pay (GH¢) Total Direct Labour Cost (GH¢)
Kwame Sarfo 262 1,048 38 57 1,105
Ajoa Mansa 240 960 16 24 984
Salomy Adiku 180 720 0 0 720
Joseph Asiedu 332 1,328 108 162 1,490
Thomas Tinge 204 816 0 0 816
Total 5,115

ii) Calculation of total indirect labour cost for the month:

Name Indirect Labour Cost (GH¢)
Kwame Sarfo 57
Ajoa Mansa 24
Salomy Adiku 80
Joseph Asiedu 162
Thomas Tinge 0
Total 323

b) i) Examples of inventory ordering cost:

  1. The cost associated with the selection of suppliers.
  2. Processing of procurement, placing advertisements for the supply of goods, tender documentation, and meeting expenses. (Any 2 points @ 1 mark each = 2 marks)

ii) Examples of inventory holding cost:

  1. Rent of warehouse.
  2. Electricity cost.
  3. Insurance of stock.
  4. Deterioration of stock.
  5. Staff cost. (Any 3 points @ 1 mark each = 3 marks)

c) Uses of standard costing:

  1. To assign per unit costs to production to value inventory.
  2. To control overhead spending.
  3. To measure and evaluate the use of production capacity with respect to the incurrence of fixed overhead costs. (Any 2 points @ 2.5 marks each = 5 marks)


a) Costs may be classified in various ways according to their nature and the information needs of management.

Required:
Explain the following pairs of costs:
i) Direct and Indirect Costs (3 marks)
ii) Fixed and Variable Costs (3 marks)
iii) Controllable and Non-controllable Costs (3 marks)
iv) Production and Non-production Costs (3 marks)
v) Relevant and Irrelevant costs (3 marks)

b) QQQ Ltd has been reporting using an absorption costing technique. However, at a management retreat attended by the Cost and Management Accountant, they discussed the information usefulness of marginal costing reports for short-term decision making extensively.

Required:
Outline FIVE (5) advantages of a marginal costing system of reporting compared to absorption costing system for consideration by the management of QQQ Ltd. (5 marks)


a) i) Direct and Indirect Costs:

  • Direct costs can be directly identified with a specific cost unit or cost center. Examples include direct materials, direct labour, and direct expenses. The total of direct costs is known as the prime cost.
  • Indirect costs cannot be directly identified with a specific cost unit or cost center. Examples include indirect materials, indirect labour, and indirect expenses. The total of indirect costs is known as overheads.

ii) Fixed and Variable Costs:

  • Fixed costs are incurred for an accounting period and remain constant in total within certain activity levels.
  • Variable costs vary in total in direct proportion with the level of activity.

iii) Controllable and Non-controllable Costs:

  • Controllable costs can be influenced by a given level of managerial authority and are within the domain of that managerial authority and responsibility.
  • Non-controllable costs cannot be influenced by a given level of managerial authority and are usually determined by higher levels of managerial authority and shared among lower levels.

iv) Production and Non-production Costs:

  • Production costs relate to the manufacture of a product or the provision of a service and are included in the cost of sales. Examples include direct materials, direct labour, direct expenses, and production overheads.
  • Non-production costs are not directly associated with the production of the business’s output and are charged to the statement of profit or loss as expenses for the period they are incurred. Examples include administrative, selling, and finance costs.

v) Relevant and Irrelevant Costs:

  • Relevant costs make a difference in decision making, are generally incremental, futuristic in nature, and involve cash outlays.
  • Irrelevant costs do not vary with a given decision under consideration and do not impact the decision. They are usually sunk or past costs that have already been incurred or fixed costs that must be incurred regardless of the decision.

b) Advantages of marginal costing over absorption costing:

  1. It discourages stock build-up.
  2. There is no under or over absorption of overheads, and hence no adjustment is required in the statement of profit or loss.
  3. Fixed costs are treated as period costs and charged in full to the period under consideration.
  4. Marginal costing is useful in short-term decision-making processes.
  5. It is simple to operate.
  6. Separating costs into fixed and variable facilitates cost control. (Any 5 points @ 1 mark each = 5 marks)

Notes:
i) The fixed cost in the semi-variable cost is GH¢10,000.
ii) The budgeted units were 10,000, but actual units for the quarter were 17,000.

Required:
Prepare a Flexed Budget for the first quarter. (15 marks)

b) In the budget preparation process, the Budget Manual is an important element. This is because it guides everyone in the budget preparation value chain.

Required:
Identify FIVE (5) rules and instructions that a Budget Manual will set out. (5 marks)

b) Budget manual may set out the following:

  1. Key objectives
  2. Planning procedures
  3. Instructions about budget details
  4. Responsibilities for preparation of functional budgets
  5. Approval process
  6. Key budget factors (Any 5 points @ 1 mark each = 5 marks)

a) Cost-Volume-Profit (CVP) analysis is a way to find out how changes in variable and fixed costs affect a firm’s profit. Companies can use CVP to assess the impact on profit taking into consideration some assumptions.

Required:
State FIVE (5) assumptions underlying Cost-Volume-Profit Analysis. (5 marks)

b) The following data has been extracted from the operating records of Sharp Production Ltd:

Year Costs (GH¢) Profit (GH¢)
2019 402,000 54,000
2020 510,000 90,000

Required: i) Calculate the contribution/sales ratio for the company. (5 marks) ii) Compute the total fixed costs per annum. (5 marks) iii) Compute the sales value required to breakeven. (5 marks)


a) Assumptions underlying CVP Analysis:

  1. All costs can be conveniently segregated into fixed and variable elements.
  2. Total fixed costs remain constant while variable costs vary proportionately with the level of activity.
  3. The selling price per unit is given and remains constant over the relevant range of activity.
  4. All that is produced can be sold at the prevailing price.
  5. The only factor affecting costs and revenues is the volume of activity.
  6. Technology, production methods, and efficiency remain unchanged.
  7. There are no inventory level changes, or inventories are valued at marginal cost.
  8. There is no uncertainty.
  9. A single product or a constant product mix is produced and sold. (Any 5 points @ 1 mark each = 5 marks)

b) Workings:

Year Cost (GH¢) Profit (GH¢) Revenue (GH¢)
2019 402,000 54,000 456,000
2020 510,000 90,000 600,000
Revenue Cost
High 600,000
Low 456,000
Change 144,000


ii) Computation of Total Fixed Costs:

Year Revenue (GH¢) TC (GH¢) TVC (GH¢) TFC (GH¢)
2019 456,000 402,000 342,000 60,000
2020 600,000 510,000 450,000 60,000

Alternatively: Using higher sales level: Contribution = 0.25 x GH¢600,000 = GH¢150,000 Profit = contribution – FC GH¢90,000 = GH¢150,000 – FC This implies FC = GH¢60,000 (5 marks)