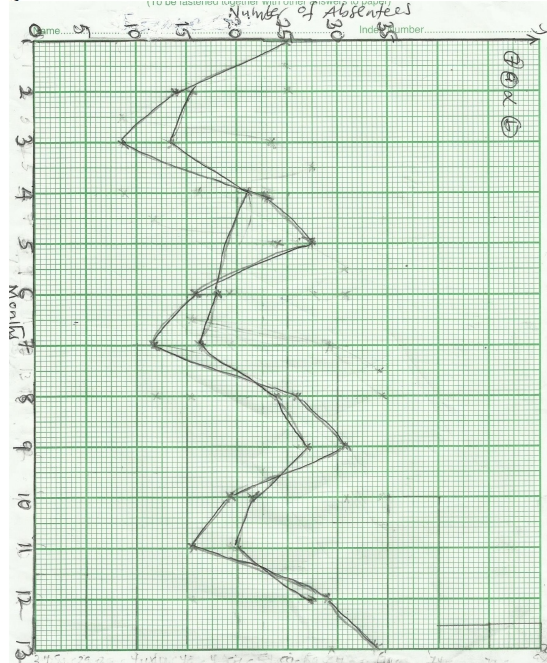
- 20 Marks
Question
The personnel department of Dropper Ltd, a large cocoa processing company in DropperLand, is concerned about absenteeism among its shop floor workforce. The mean number of absentees per day for each quarter of the years 1999 to 2001 and Quarter 1 in 2002 is given in the table below:
Q1 | Q2 | Q3 | Q4 | |
---|---|---|---|---|
1999 | 25.10 | 14.40 | 9.50 | 23.70 |
2000 | 27.90 | 16.90 | 12.40 | 26.10 |
2001 | 31.40 | 19.70 | 15.90 | 29.90 |
2002 | 34.50 | – | – | – |
Required:
a) Plot the data on a graph, leaving space for the remaining 2002 figures. (3 marks)
b) Using the method of 2-quarterly centered moving averages,
i) Determine the trend in the series and superimpose this on your graph in (a). (4 marks)
ii) Determine the equation of the trend line above by considering only the first and last centered moving average value on your graph in (i). (3 marks)
c) Using an appropriate decomposition model, determine the seasonal variations in the data. Give reasons for your choice of model. (5 marks)
d) Use your analysis above to roughly forecast the mean number of absentees for the remaining quarters of 2002. Comment on your forecast. (5 marks)
Answer
a)
b)
i
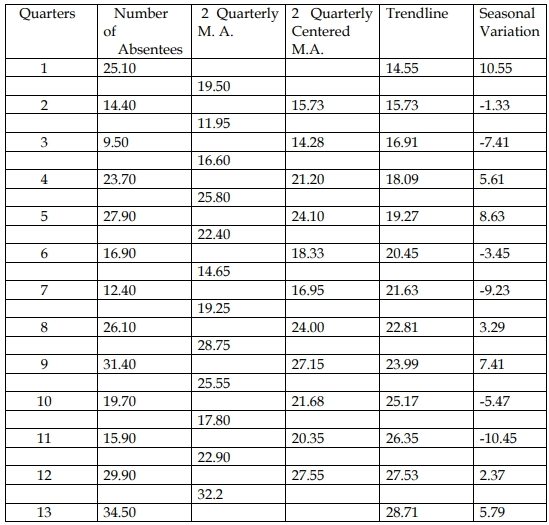
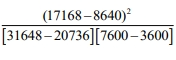
(ii) The gradient of the trend line is given by:
b = = 1.182
Therefore, the trendline based on the 2 – quarterly centered moving average is given by:
y = 15.73 + 1.18x
Where x represents the quarter.
c)
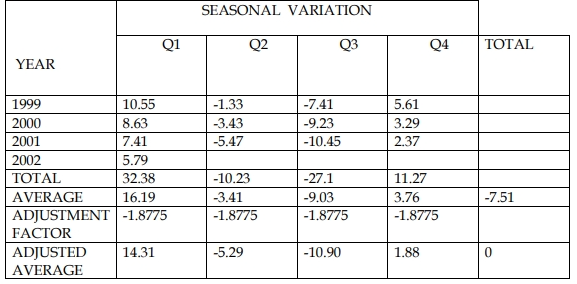
REASON: I use the additive model because from the graph in (a) above seasonal
variation are not affected by the increasing trend factors.
d)
d) Using the analysis for forecasting:
2002 Quarters | Trendline | Average Seasonal Variation | Seasonally Adjusted Forecast |
---|---|---|---|
Q2 | 29.89 | -5.29 | 24.60 |
Q3 | 31.07 | -10.90 | 20.17 |
Q4 | 32.25 | 1.88 | 34.13 |
Comment: The forecasts are not reliable because they are based on extrapolations beyond the range of the existing data.
- Tags: Absenteeism, Forecasting, Seasonal Variations, Time series, Trend
- Level: Level 1
- Topic: Forecasting
- Series: NOV 2016
- Uploader: Joseph