a) Financial performance and competitiveness
VAR achieved a net profit that was over 12% in excess of the budget in 2016. Total sales grew by 7% in 2016 compared with 2015, in spite of the fact that the budget provided for very little revenue growth. The net profit margin was 21.1%, compared with 19.9% in 2015 and 19.5% in 2014. VAR appears to have established a very profitable and successful business in the three years since it was established.
The competitiveness of VAR can be judged to some extent by the increase in the number of clients, which has gone up from 160 in 2014 to 350 in 2015. The average revenue per client, however, has gone down. On average, clients were paying for 23.6 days of advice in 2016.
However, there is no information about the share of the market that VAR now has for professional advice.
(Any 2 valid points explained =4 marks)
b) Internal efficiency
Internal efficiency can be measured by productivity. The budgeted number of chargeable client days was 7,700 days. The total number of adviser days in the year should have been 11,000 (50 × 220 days). This means that the budget was for 70% of days to be chargeable days, and 30% non-chargeable. Actual chargeable days were 8,250, which was 75% of total days, leaving 25% of days as non-chargeable days. This indicates that actual productivity in earning revenue was better than the budget target.
Internal efficiency and external efficiency can both be measured by flexibility. VAR has a policy of restricting the team of advisers to 50. However, within this limit of 50 advisers, VAR has been flexible enough to respond to a pattern of customer demand in which the demand for accounting advice was less than budget but the demand for advice on compliance is much higher. This suggests that VAR has the flexibility to switch advisers from one specialty to another.
At an operational level, internal efficiency can be measured by process time. The information provided shows that the average time to complete each ‘job’ has continued to fall, indicating greater efficiency, and a growing number of ‘jobs’ are being completed within the target time of 10 days.
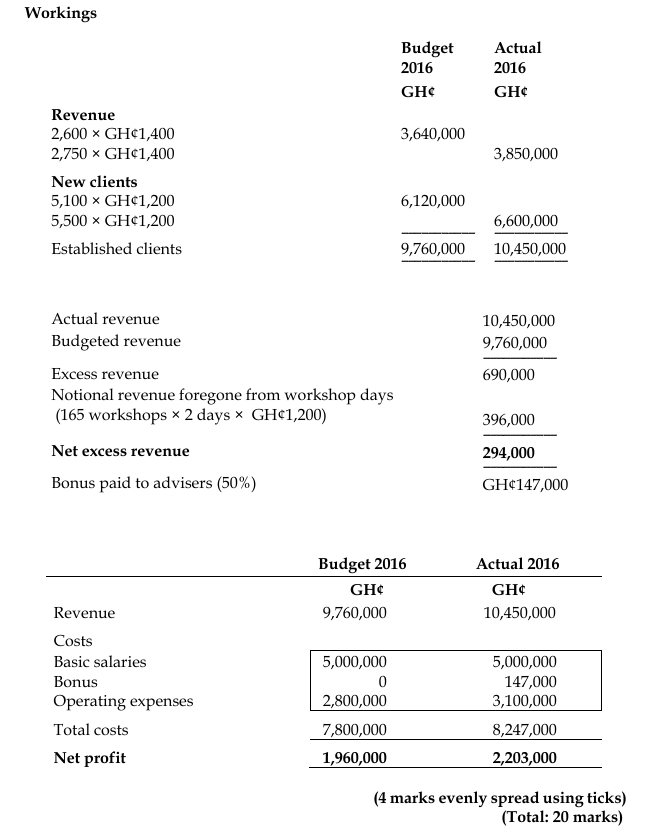
Internal efficiency can also be measured at an operational level by waste. Here, the performance is not as good as it might have been. Waste could be measured by the number of ‘no fee’ workshops given to clients. These have gone up by 50% since 2014, to 15 workshops in 2016. At two days per workshop, this represents 330 days that have been lost that might otherwise have been used to earn income. The potential loss of revenue at GH¢1,400 a day was therefore GH¢462,000.
Management should look into the reasons for the growth in the number of workshops, to establish what measures might be taken to reverse the trend.
(Any 4 valid points explained @1.5 marks =6 marks)
c) External effectiveness
External satisfaction can be measured by customer satisfaction and flexibility (as indicated earlier). There are some indications that customer satisfaction is quite high. The growth in client numbers is one indicator.
A better indicator might be the rate of converting enquiries into ‘sales’. The budget for 2016 provided for 7,700 chargeable days and an average of 4 days per ‘job’. This means that the budget provided for 1,925 ‘jobs’. It also provided for 6,600 enquiries from customers, which means that about 30% of enquiries would be converted into fee-earning work.
Actual results in 2016 were 8,250 chargeable days, giving about 2,062.5 ‘jobs’. There were 5,900 enquiries, making a conversion rate of about 35% of enquiries into fee-earning work. This indicates that actual performance was better than budget in this all-important area of making sales.
Increasing customer satisfaction might also be evident in the decline in the number of customer complaints, which was down to 5 in 2016. However, it is not clear that the increasing number of consultations (business development) is having a significant effect in increasing sales. This should be investigated.