Series: MAY 2017

Search 500 + past questions and counting.
  • Filter by Professional Bodies

  • Filter by Subject

  • Filter by Series

  • Filter by Topics

  • Filter by Levels

QTB – May 2017 – L1 – SB – Q6a – Statistics

Calculate the monthly cost of replacing diodes based on failure probability and determine if a student can buy a gown based on expected money.

i. The laptops that are purchased by a company have 742 diodes with a life span of five months. These diodes fail on a regular basis according to the following probability distribution:

Life (months) 1 2 3 4 5
Probability of failure 0.10 0.30 0.35 0.20 0.05

If the cost of replacing a diode is ₦100, calculate the monthly cost of replacing the diodes as they fail. (4 Marks)

ii. Tadet, a student in the Accountancy Department of a Polytechnic, has the following chances of receiving money from her relatives:

  • 45% chance of receiving ₦5,000 from her sister,
  • 33% chance of receiving ₦8,000 from her brother,
  • 16% chance of receiving ₦11,000 from her aunt,
  • 6% chance of receiving ₦15,000 from her uncle.

Determine if Tadet will be able to buy a gown worth ₦8,000 from the money she is expecting from her relatives. (6 Marks)

Login or create a free account to see answers

Find Related Questions by Tags, levels, etc.

Report an error

You're reporting an error for "QTB – May 2017 – L1 – SB – Q6a – Statistics"

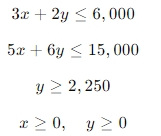
QTB – May 2017 – L1 – SB – Q5a – Operations Research

Graph linear inequalities and identify the coordinates of the corner points of the shaded area.

a. Given the following inequalities:

i. Graph them on the same graph sheet using the following scales: On x and y-axes, let 1 cm represent 250 units. (6½ Marks)

ii.

  • Shade the area in which these inequalities hold.
  • Determine the coordinates of the corner points of the above shaded area. (3½ Marks)


Login or create a free account to see answers

Find Related Questions by Tags, levels, etc.

Report an error

You're reporting an error for "QTB – May 2017 – L1 – SB – Q5a – Operations Research"

QTB – May 2017 – L1 – SB – Q4b – Statistics

Identify non-basic variables in a transportation model and calculate the probability of a specific event in random disk selection.

i. Given the following initial basic tableau of a transportation problem:

(note that the tiny numbers are the unit costs)

Identify the non-basic variables and compute their corresponding
relative cost coefficients. (4marks)

ii. A bag contains 39,800 white disks and 200 black disks from which
1,000 disks are taken at random. Calculate the probability that the
sample contains 4 black disks. (6marks)

Login or create a free account to see answers

Find Related Questions by Tags, levels, etc.

Report an error

You're reporting an error for "QTB – May 2017 – L1 – SB – Q4b – Statistics"

QTB – May 2017 – L1 – SB – Q4a – Statistics

Calculate the proportion of damaged blocks and the probability of taking a damaged block from a specific lorry using a tree diagram.

a. A fleet of lorries A, B, and C are loaded with blocks meant for a building site.
Lorry A carries 2/5 of all the needed blocks, B carries 3/4 of what lorry A carries, and lorry C carries the rest. Lorries A, B, and C contain 13%, 15%, and 11% damaged blocks, respectively.

By drawing a suitable tree diagram, calculate:
i. The proportion of damaged blocks in the fleet. (8 Marks)

ii. The probability of randomly taking a damaged block from lorry B. (2 Marks)

Login or create a free account to see answers

Find Related Questions by Tags, levels, etc.

Report an error

You're reporting an error for "QTB – May 2017 – L1 – SB – Q4a – Statistics"

QTB – May 2017 – L1 – SB – Q3b – Data Collection Analysis

Find the regression equation between QTB and FA marks and estimate values.

The table below gives the scores of seven candidates in Quantitative Techniques in Business (QTB) and Financial Accounting (FA) of ICAN Professional Examination:

QTB Marks (y) 50 72 36 64 52 56 80
FA Marks (x) 38 51 19 53 39 38 66

You are required to:
i. Obtain the regression equation if the mark in QTB is regressed on FA. (6 Marks)

ii. Obtain the estimate of mark in QTB, if the mark in FA is 60. (2 Marks)

iii. Obtain the estimate of mark in FA, if the mark in QTB is 75. (2 Marks)

Login or create a free account to see answers

Find Related Questions by Tags, levels, etc.

Report an error

You're reporting an error for "QTB – May 2017 – L1 – SB – Q3b – Data Collection Analysis"

QTB – May 2017 – L1 – SB – Q3a – Mathematics

Determine the annual savings required to accumulate a future sum under annuity terms.

A lawyer plans to save a certain amount of money Nx per annum for 5 years on the first day of the year. If the interest rate is 8%, for him to receive N696,910.50, determine x. (10 Marks)


Login or create a free account to see answers

Find Related Questions by Tags, levels, etc.

Report an error

You're reporting an error for "QTB – May 2017 – L1 – SB – Q3a – Mathematics"

QTB – May 2017 – L1 – SB – Q2b – Data Collection and Analysis

Determine angles for pie chart representation and complete a project network diagram with project duration.

i. The monthly expenditure (₦’000) of a household on some items are given as follows:

Item Expenditure (₦’000)
Food 50
Transport 25
Utilities 35
Miscellaneous 10

Determine the angle which will represent each item on a pie chart. (6 Marks)

ii. The activities needed to complete a project with their durations (in weeks) are given below:

Activity Preceding Activity Duration (weeks)
A 4
B 6
C A 8
D B 12
E B 11
F C, D 9

You are required to draw the activity-on-arrow network diagram for the project and determine the duration of the project. (4 Marks)

Login or create a free account to see answers

Find Related Questions by Tags, levels, etc.

Report an error

You're reporting an error for "QTB – May 2017 – L1 – SB – Q2b – Data Collection and Analysis"

QTB – May 2017 – L1 – SB – Q2a – Statistics

Probability calculations for dice roll and random sampling in block production.

i. A six-sided and fair die is thrown into the air. What is the probability:

  • Of NOT getting a SIX?
  • That either a THREE, a FOUR, or a FIVE will fall uppermost?
  • Of obtaining an even number?
    (5 Marks)

ii. A block-making factory produces TWO types of blocks: 6-inch and 9-inch. ONE quarter of its output on a particular day are 6-inch blocks, while the remaining three-quarters are 9-inch blocks. If samples of 3 are taken at random, what is the probability of obtaining:

  • One 6-inch block?
  • Two 6-inch blocks?
  • One or two 6-inch blocks?
    (5 Marks)

Login or create a free account to see answers

Find Related Questions by Tags, levels, etc.

Report an error

You're reporting an error for "QTB – May 2017 – L1 – SB – Q2a – Statistics"

QTB – May 2017 – L1 – SB – Q1b – Data Collection Analysis

Construct a histogram and determine the modal wage from the wage distribution data.

b. The table below shows the weekly wage distribution of artisans in a certain factory:

Weekly Wage (₦’00) Number of Artisans
38 – 47 16
48 – 57 24
58 – 67 41
68 – 77 53
78 – 87 76
88 – 97 118
98 – 107 224
108 – 117 83
118 – 127 15
128 – 137 4

i. Draw a histogram to represent the wage distribution using the scales: On x-axis, let 1 cm represent ₦100; on y-axis, let 1 cm represent 10 artisans. (4 Marks)

ii. Deduce the modal weekly wage from the histogram. (2½ Marks)

iii. Use the appropriate formula to calculate the modal weekly wage. (3½ Marks)

Login or create a free account to see answers

Find Related Questions by Tags, levels, etc.

Report an error

You're reporting an error for "QTB – May 2017 – L1 – SB – Q1b – Data Collection Analysis"

QTB – May 2017 – L1 – SB – Q1a – Mathematics

Machine replacement time and net earnings calculation considering repair costs.

a. A manufacturing company has purchased a machine generating earnings (₦’000) at time t of , where t is in years. The repair and maintenance cost at time t is
You are required to:

i. Determine when the machine should be replaced, assuming it has a zero salvage value. (4 Marks)

ii. Determine the total net earnings, including the cost of repairs and maintenance within the period of 11 years. (6 Marks)

Login or create a free account to see answers

Find Related Questions by Tags, levels, etc.

Report an error

You're reporting an error for "QTB – May 2017 – L1 – SB – Q1a – Mathematics"

QTB – May 2017 – L1 – SB – Q6a – Statistics

Calculate the monthly cost of replacing diodes based on failure probability and determine if a student can buy a gown based on expected money.

i. The laptops that are purchased by a company have 742 diodes with a life span of five months. These diodes fail on a regular basis according to the following probability distribution:

Life (months) 1 2 3 4 5
Probability of failure 0.10 0.30 0.35 0.20 0.05

If the cost of replacing a diode is ₦100, calculate the monthly cost of replacing the diodes as they fail. (4 Marks)

ii. Tadet, a student in the Accountancy Department of a Polytechnic, has the following chances of receiving money from her relatives:

  • 45% chance of receiving ₦5,000 from her sister,
  • 33% chance of receiving ₦8,000 from her brother,
  • 16% chance of receiving ₦11,000 from her aunt,
  • 6% chance of receiving ₦15,000 from her uncle.

Determine if Tadet will be able to buy a gown worth ₦8,000 from the money she is expecting from her relatives. (6 Marks)

Login or create a free account to see answers

Find Related Questions by Tags, levels, etc.

Report an error

You're reporting an error for "QTB – May 2017 – L1 – SB – Q6a – Statistics"

QTB – May 2017 – L1 – SB – Q5a – Operations Research

Graph linear inequalities and identify the coordinates of the corner points of the shaded area.

a. Given the following inequalities:

i. Graph them on the same graph sheet using the following scales: On x and y-axes, let 1 cm represent 250 units. (6½ Marks)

ii.

  • Shade the area in which these inequalities hold.
  • Determine the coordinates of the corner points of the above shaded area. (3½ Marks)


Login or create a free account to see answers

Find Related Questions by Tags, levels, etc.

Report an error

You're reporting an error for "QTB – May 2017 – L1 – SB – Q5a – Operations Research"

QTB – May 2017 – L1 – SB – Q4b – Statistics

Identify non-basic variables in a transportation model and calculate the probability of a specific event in random disk selection.

i. Given the following initial basic tableau of a transportation problem:

(note that the tiny numbers are the unit costs)

Identify the non-basic variables and compute their corresponding
relative cost coefficients. (4marks)

ii. A bag contains 39,800 white disks and 200 black disks from which
1,000 disks are taken at random. Calculate the probability that the
sample contains 4 black disks. (6marks)

Login or create a free account to see answers

Find Related Questions by Tags, levels, etc.

Report an error

You're reporting an error for "QTB – May 2017 – L1 – SB – Q4b – Statistics"

QTB – May 2017 – L1 – SB – Q4a – Statistics

Calculate the proportion of damaged blocks and the probability of taking a damaged block from a specific lorry using a tree diagram.

a. A fleet of lorries A, B, and C are loaded with blocks meant for a building site.
Lorry A carries 2/5 of all the needed blocks, B carries 3/4 of what lorry A carries, and lorry C carries the rest. Lorries A, B, and C contain 13%, 15%, and 11% damaged blocks, respectively.

By drawing a suitable tree diagram, calculate:
i. The proportion of damaged blocks in the fleet. (8 Marks)

ii. The probability of randomly taking a damaged block from lorry B. (2 Marks)

Login or create a free account to see answers

Find Related Questions by Tags, levels, etc.

Report an error

You're reporting an error for "QTB – May 2017 – L1 – SB – Q4a – Statistics"

QTB – May 2017 – L1 – SB – Q3b – Data Collection Analysis

Find the regression equation between QTB and FA marks and estimate values.

The table below gives the scores of seven candidates in Quantitative Techniques in Business (QTB) and Financial Accounting (FA) of ICAN Professional Examination:

QTB Marks (y) 50 72 36 64 52 56 80
FA Marks (x) 38 51 19 53 39 38 66

You are required to:
i. Obtain the regression equation if the mark in QTB is regressed on FA. (6 Marks)

ii. Obtain the estimate of mark in QTB, if the mark in FA is 60. (2 Marks)

iii. Obtain the estimate of mark in FA, if the mark in QTB is 75. (2 Marks)

Login or create a free account to see answers

Find Related Questions by Tags, levels, etc.

Report an error

You're reporting an error for "QTB – May 2017 – L1 – SB – Q3b – Data Collection Analysis"

QTB – May 2017 – L1 – SB – Q3a – Mathematics

Determine the annual savings required to accumulate a future sum under annuity terms.

A lawyer plans to save a certain amount of money Nx per annum for 5 years on the first day of the year. If the interest rate is 8%, for him to receive N696,910.50, determine x. (10 Marks)


Login or create a free account to see answers

Find Related Questions by Tags, levels, etc.

Report an error

You're reporting an error for "QTB – May 2017 – L1 – SB – Q3a – Mathematics"

QTB – May 2017 – L1 – SB – Q2b – Data Collection and Analysis

Determine angles for pie chart representation and complete a project network diagram with project duration.

i. The monthly expenditure (₦’000) of a household on some items are given as follows:

Item Expenditure (₦’000)
Food 50
Transport 25
Utilities 35
Miscellaneous 10

Determine the angle which will represent each item on a pie chart. (6 Marks)

ii. The activities needed to complete a project with their durations (in weeks) are given below:

Activity Preceding Activity Duration (weeks)
A 4
B 6
C A 8
D B 12
E B 11
F C, D 9

You are required to draw the activity-on-arrow network diagram for the project and determine the duration of the project. (4 Marks)

Login or create a free account to see answers

Find Related Questions by Tags, levels, etc.

Report an error

You're reporting an error for "QTB – May 2017 – L1 – SB – Q2b – Data Collection and Analysis"

QTB – May 2017 – L1 – SB – Q2a – Statistics

Probability calculations for dice roll and random sampling in block production.

i. A six-sided and fair die is thrown into the air. What is the probability:

  • Of NOT getting a SIX?
  • That either a THREE, a FOUR, or a FIVE will fall uppermost?
  • Of obtaining an even number?
    (5 Marks)

ii. A block-making factory produces TWO types of blocks: 6-inch and 9-inch. ONE quarter of its output on a particular day are 6-inch blocks, while the remaining three-quarters are 9-inch blocks. If samples of 3 are taken at random, what is the probability of obtaining:

  • One 6-inch block?
  • Two 6-inch blocks?
  • One or two 6-inch blocks?
    (5 Marks)

Login or create a free account to see answers

Find Related Questions by Tags, levels, etc.

Report an error

You're reporting an error for "QTB – May 2017 – L1 – SB – Q2a – Statistics"

QTB – May 2017 – L1 – SB – Q1b – Data Collection Analysis

Construct a histogram and determine the modal wage from the wage distribution data.

b. The table below shows the weekly wage distribution of artisans in a certain factory:

Weekly Wage (₦’00) Number of Artisans
38 – 47 16
48 – 57 24
58 – 67 41
68 – 77 53
78 – 87 76
88 – 97 118
98 – 107 224
108 – 117 83
118 – 127 15
128 – 137 4

i. Draw a histogram to represent the wage distribution using the scales: On x-axis, let 1 cm represent ₦100; on y-axis, let 1 cm represent 10 artisans. (4 Marks)

ii. Deduce the modal weekly wage from the histogram. (2½ Marks)

iii. Use the appropriate formula to calculate the modal weekly wage. (3½ Marks)

Login or create a free account to see answers

Find Related Questions by Tags, levels, etc.

Report an error

You're reporting an error for "QTB – May 2017 – L1 – SB – Q1b – Data Collection Analysis"

QTB – May 2017 – L1 – SB – Q1a – Mathematics

Machine replacement time and net earnings calculation considering repair costs.

a. A manufacturing company has purchased a machine generating earnings (₦’000) at time t of , where t is in years. The repair and maintenance cost at time t is
You are required to:

i. Determine when the machine should be replaced, assuming it has a zero salvage value. (4 Marks)

ii. Determine the total net earnings, including the cost of repairs and maintenance within the period of 11 years. (6 Marks)

Login or create a free account to see answers

Find Related Questions by Tags, levels, etc.

Report an error

You're reporting an error for "QTB – May 2017 – L1 – SB – Q1a – Mathematics"

error: Content is protected !!
Oops!

This feature is only available in selected plans.

Click on the login button below to login if you’re already subscribed to a plan or click on the upgrade button below to upgrade your current plan.

If you’re not subscribed to a plan, click on the button below to choose a plan