Question
Answer
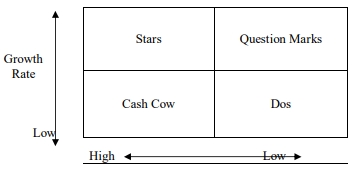
The Boston Consulting Group (BCG) matrix is a model by which businesses are
classified in relation to market growth and relative market share.
The strategy of each business is determined on the basis of the following factors:
(i) The growth rate of its market
(ii) The market share it enjoys
The matrix can be depicted by the following quadrant:
![]()
b. Product-Market Strategies:
i. Stars:
Stars operate in high-growth markets and dominate their sectors. They require substantial investment to maintain market position but promise high returns. The recommended product-market strategy is to continue heavy investment in advertising, promotion, and product development to ensure growth in market share and revenue.
ii. Question Marks (Problem Children):
These products operate in high-growth markets but have low market share. They create opportunities for long-term growth but need significant cash investments. The suggested strategy is to either invest heavily to turn them into stars or divest if the market position does not improve. This may involve strategic decisions like harvesting or liquidation.
iii. Cash Cows:
These products have high market share in low-growth markets. They generate consistent cash flows but offer limited growth opportunities. The strategy is to maintain or consolidate their position, using their revenue to fund other areas of the business that require investment (such as Stars or Question Marks).
iv. Dogs:
Dogs have low market share in low-growth markets, providing little to no profit potential. The strategy is often to divest or liquidate these products, as they are not worth the continued investment given their bleak future.
c. Weaknesses of the BCG Matrix:
- The model ignores the synergies between different business units, which can affect overall profitability.
- High market share does not always guarantee profitability, as it depends on other factors such as cost structure and competitive advantage.
Question
Answer
The Boston Consulting Group (BCG) matrix is a model by which businesses are
classified in relation to market growth and relative market share.
The strategy of each business is determined on the basis of the following factors:
(i) The growth rate of its market
(ii) The market share it enjoys
The matrix can be depicted by the following quadrant:
![]()
b. Product-Market Strategies:
i. Stars:
Stars operate in high-growth markets and dominate their sectors. They require substantial investment to maintain market position but promise high returns. The recommended product-market strategy is to continue heavy investment in advertising, promotion, and product development to ensure growth in market share and revenue.
ii. Question Marks (Problem Children):
These products operate in high-growth markets but have low market share. They create opportunities for long-term growth but need significant cash investments. The suggested strategy is to either invest heavily to turn them into stars or divest if the market position does not improve. This may involve strategic decisions like harvesting or liquidation.
iii. Cash Cows:
These products have high market share in low-growth markets. They generate consistent cash flows but offer limited growth opportunities. The strategy is to maintain or consolidate their position, using their revenue to fund other areas of the business that require investment (such as Stars or Question Marks).
iv. Dogs:
Dogs have low market share in low-growth markets, providing little to no profit potential. The strategy is often to divest or liquidate these products, as they are not worth the continued investment given their bleak future.
c. Weaknesses of the BCG Matrix:
- The model ignores the synergies between different business units, which can affect overall profitability.
- High market share does not always guarantee profitability, as it depends on other factors such as cost structure and competitive advantage.