Ken and Yon are two divisions of a large company that operate in similar markets. The divisions are treated as investment centres, and every month each division prepares an operating statement and submits it to the parent company. Operating statements for the two divisions for October are stated below:

Operating Statements for October Ken (GH¢000) Yon (GH¢000)
Sales revenue 900 555
Variable costs 345 312
Controllable fixed costs (includes depreciation on division assets) 433 222
Uncontrollable apportioned central costs 15 5
Divisional net assets for the year 9,760 1,260

The company currently has a target return on capital of 12% per annum. However, the company believes its cost of capital is likely to rise and it is considering increasing the target return on capital. Currently, the performance of each division and the divisional management are assessed primarily based on Return on Investment (ROI) using controllable profit.

Required:

i) Calculate the annualised Return on Investment (ROI) for divisions Ken and Yon, and discuss their relative performances. (6 marks)
ii) Calculate the annualised Residual Income (RI) using controllable profit for divisions Ken and Yon, and evaluate their division’s performances. (6 marks)
iii) Using appropriate ratios, evaluate the efficiency of the two divisions. (3 marks)

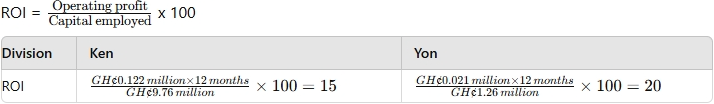
i) Return on Investment (ROI):

Discussion of relative performance:

  • Division Yon has the highest return on investment (20%) in comparison to division Ken (15%).
  • Both divisions exceed the target of 12% per annum set by the parent company. However, division Ken will be at greater risk if the target return on investment is increased.
  • Both divisions are profitable and generate a positive contribution for the group.
  • In absolute terms, division Ken is larger in terms of net assets and generates greater absolute profit than division Yon.

ii) Residual Income (RI):
Residual income = Profit before interest and tax – (Capital employed × cost of capital)

Division Ken (GH¢ million) Yon (GH¢ million)
Profit before interest and tax (annualised) 1.464 0.252
Capital employed cost of capital 1.171 0.151
Residual Income 0.293 0.101

Evaluation:

  • Division Ken contributes greater wealth for the group, demonstrated by a higher residual income.
  • Residual income is superior as it accounts for the absolute size of wealth generated rather than just relative returns.

iii) Efficiency ratios:

Division Ken is more operationally efficient with lower variable costs to sales (38.3% vs 56.2% for Yon).