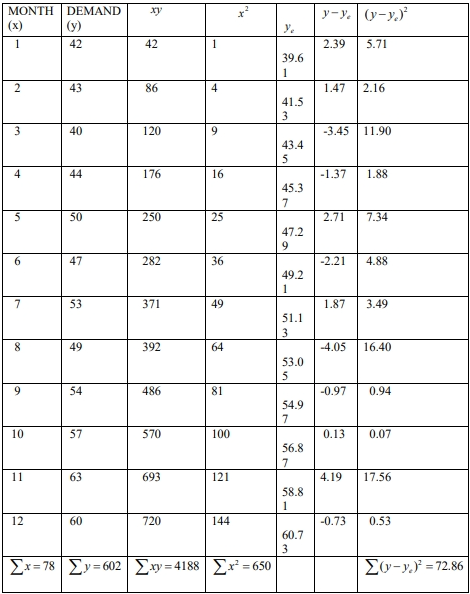
Question Tag: Trend Analysis

Search 500 + past questions and counting.
Professional Bodies Filter
Program Filters
Subject Filters
More
Tags Filter
More
Check Box – Levels
Series Filter
More
Topics Filter
More

The monthly demand for maize (in hundreds of bags) for the last year in Bosua Market is shown below:

Month Jan Feb Mar Apr May Jun Jul Aug Sep Oct Nov Dec
Demand 42 43 40 44 50 47 53 49 54 57 63 60

Required:
(a) Calculate the regression line y=a+bxy = a + bx for the data. (9 Marks)

(b) Using the regression line in (a), determine the forecast for next year:
(i) January, (1 Mark)
(ii) February, (1 Mark)
(iii) March. (1 Mark)

(c) Determine the Standard Error in forecasting demand in (b). (8 Marks)

(a) ,(b) and (c)

b)

i) y=37.67 + 1.92(13) = 62.63

ii) y=37.67 + 1.92(14) = 64.55

iii) y=37.67 + 1.92(15) = 66.47

c)

Standard Error :


Quarterly sales of a Golden Tree Chocolate Bar at a popular mall in KoKoLand City are given as follows:

YEAR QUARTER 1 QUARTER 2 QUARTER 3 QUARTER 4
1 1260 756 588 1596
2 1352 966 579 2028
3 1786 920 865 2273

Required:
(i) Calculate the trend in the series using a 4-point centered moving average method. (4 Marks)

(ii) Using (i), calculate the Average Seasonal Variation based on the Additive Model of Time Series analysis. (4 Marks)

(iii) Using the values in (ii), determine the Adjusted Average Seasonal Variation for the Time Series Data. (4 Marks)

(iv) Prepare Seasonal Adjusted Forecast for Year 4 using the Additive Model. (4 Marks)

(i) Calculation of Trend using a 4-point centered moving average method:

TIME SALES (A) 4-POINT MOVING TOTAL 4-POINT MOVING AVERAGE CENTERED MOVING AVERAGE (T) SEASONAL EFFECT (A-T)
1 1260
2 756 4200 1050.00
3 588 4292 1073.00 1062 -474
4 1596 4502 1125.50 1099 497
5 1352 4495 1123.25 1124 228
6 966 4925 1231.25 1177 -211
7 579 5359 1339.75 1286 -707
8 2028 5513 1328.75 1334 694
9 1786 5599 1399.75 1364 422
10 920 5844 1461.00 1430 -510
11 865
12 2273


(ii) Calculation of Average Seasonal Variation based on the Additive Model:

YEAR QUARTER 1 QUARTER 2 QUARTER 3 QUARTER 4
1 -474 497
2 228 -211 -707 694
3 422 -510

| TOTAL | 650 | -721 | -1181 | 1191 |

| AVERAGE | 325 | -360.5 | -590.5 | 595.5 |


(iii) Adjusted Average Seasonal Variation:

QUARTER AVERAGE ADJUSTMENT FACTOR ADJUSTED AVERAGE SEASONAL EFFECT
1 325.00 + 7.625 332.625
2 -360.50 + 7.625 -352.875
3 -590.50 + 7.625 -582.875
4 595.50 + 7.625 603.125


(iv) Seasonal Adjusted Forecast for Year 4:

YEAR QUARTER PERIOD TREND SEASONAL EFFECT FORECAST
4 1 13 1590 +333 1923
4 2 14 1645 -353 1292
4 3 15 1700 -583 1117
4 4 16 1755 +603 2358

The trend column above was obtained by computing the gradient using the first value of the centered moving average (1062) and the last centered moving average (1430).
The gradient = (1430 – 1062) / (10 – 3) = 52.57.
Forecasting from the last centered moving average, we evaluate the equation:
1430 + 52.57 * (x – 3), where x = 3, 4, 5, 6.

Example: Trend value of the first quarter of Year 4 is given by:
1430 + 52.57 * (3) = 1587.71 ≈ 1590.


a) Explain in brief the following features of time series:
i) Trend.
ii) Seasonal variation.
iii) Random variation.
(6 marks)

b) The following table relates to sales of Emefa Ltd for a three-year period:

Year 1st Quarter (GH¢’000) 2nd Quarter (GH¢’000) 3rd Quarter (GH¢’000) 4th Quarter (GH¢’000)
Year 1 200 150 180 260
Year 2 220 190 210 280
Year 3 240 200 220 300

Required:
i) Prepare a histogram using the above sales figures. (7 marks)
ii) Describe the trend of performance of the company. (2 marks)

c) Explain the following terminologies as used in accounting for overheads in management accounting:
i) Apportionment
ii) Allocation
iii) Allotment
iv) Absorption
v) Over/(under) absorption
(5 marks)

a)
i) Trend: This refers to the long-term movement or direction in data over a period of time. It shows whether the data is generally increasing, decreasing, or remaining stable. (2 marks)

ii) Seasonal variation: These are short-term fluctuations in data that occur at regular intervals due to seasonal factors such as weather, holidays, or events. They are predictable and repeatable. (2 marks)

iii) Random variation: These are irregular, unpredictable fluctuations in data caused by unforeseen events like political changes, natural disasters, or unexpected market shifts. They do not follow a pattern. (2 marks)

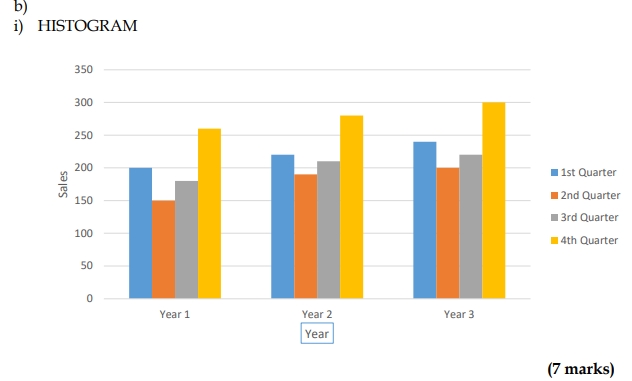
ii) Sales have generally increased over the 3-year period. In the specific years, sales
for the first quarters are generally higher than the second and third quarters with
last quarter sales being the highest. From the first quarters sales decreases in the
second quarters and start to increase in the second quarters and peaks in the fourth
quarters. So the second quarters sales are the lowest with the fourth quarters being
the highest. (2 marks)
c)
i) Apportionment
The sharing of overheads between and/or among costs centres using fair and
equitable basis. For example, floor area occupied, number of employees, number
stores requisitions, etc
ii) Allocation
This refers to the assignment of overheads in whole to costs centres. That is, the
attribution of overheads in whole to particular costs centres.
iii) Allotment
This refers to the sharing of overheads using defined proportions. For example,
2:3:1, 20%: 30%: 50%.

iv) Absorption
This refers to the charging of overheads to costs units using predetermined
absorption rates.
Example, direct labour hour rate, percentage of material cost, etc.
v) Over/(under) absorption
This refers to the difference between overheads absorbed charged to production
and the actual overheads incurred. Over absorption arises where the overheads
absorbed or charged to exceed the actual overheads incurred. On the other hand,
under absorption occurs where overheads charged to production is lower than the
actual overheads incurred.
(5 marks)

a) The monthly sales of Danamo Company Limited have been given as follows:

Monthly Sales (GH¢’000) Moving Total (GH¢’000)
April 150
May 140
June 160
July 180
August 200
September 190
October 220
November 230
December 250

Required:
i) Using the three-month moving average, calculate the trend. (3 marks)

ii) Using the line of best fit, estimate the sales of January, February, and March of the following year. (12 marks)

b) State and explain FIVE (5) sources of information that may be considered in setting standard prices for materials in Management Accounting. (5 marks)

a)
i) Three-Month Moving Average

Month Sales (GH¢’000) Moving Total (GH¢’000) Moving Average (GH¢’000)
April 150
May 140 450 150
June 160 480 160
July 180 540 180
August 200 570 190
September 190 610 203.33
October 220 640 213.33
November 230 700 233.33
December 250
(3 marks evenly spread using ticks)

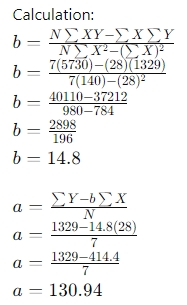
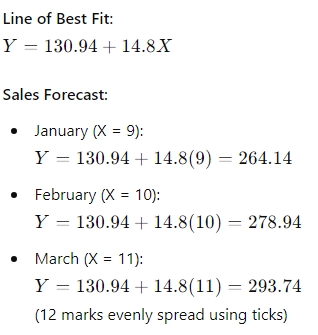
ii) Line of Best Fit

Month (X) Sales (Y) XY
1 150 150 1
2 160 320 4
3 180 540 9
4 190 760 16
5 203 1015 25
6 213 1278 36
7 233 1631 49
Total 1329 5730 140

b) Sources of Information for Setting Standard Prices

  1. Quotations and Estimates from Potential Suppliers: Price quotations or estimates provided by suppliers.
  2. Trend Information from Past Data: Historical data on material prices and trends.
  3. Bulk Discounts: Information on discounts for bulk purchases.
  4. Packaging and Carriage Inwards: Charges for packaging and transportation costs.
  5. Quality of Material: The expected quality may influence the price.
  6. Internally Manufactured Components: The predetermined standard cost for components.

(Any 5 points at 1 mark = 5 marks)