Question
GRAT Authority operates passenger railway services and is responsible for the maintenance of track signaling equipment, and other facilities such as stations. In recent years it has been criticized for providing poor services to the traveling public in terms of punctuality, safety, and the standard of facilities offered to passengers. Last year, GRAT Authority invested over GH¢20 million in new carriages, station facilities, and track maintenance programs in an attempt to address these criticisms.
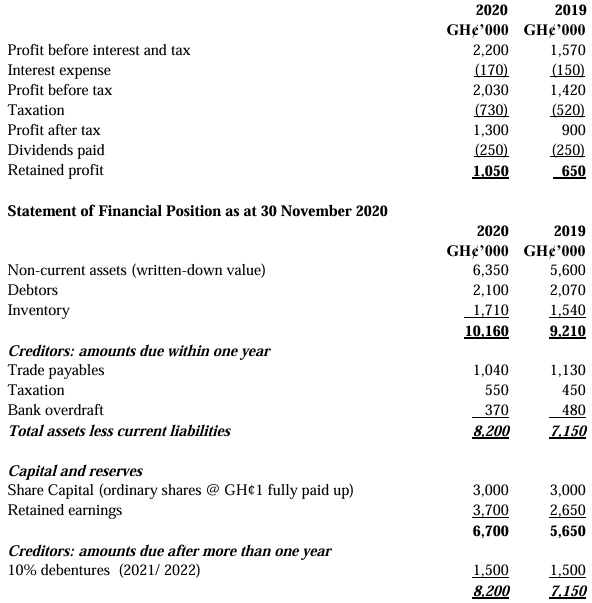
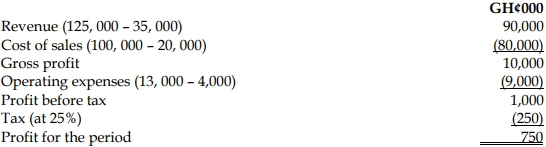
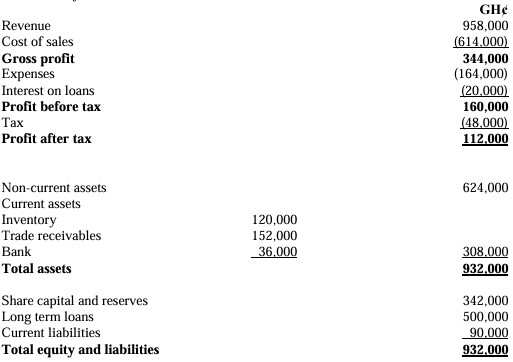
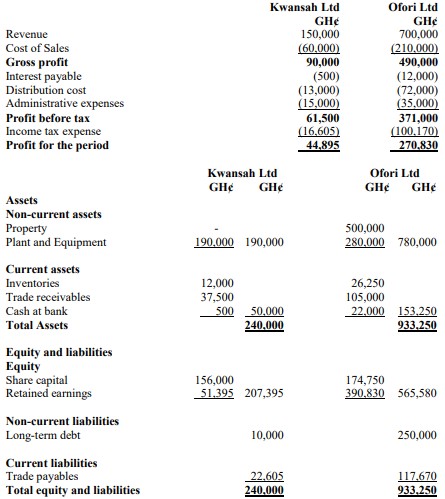
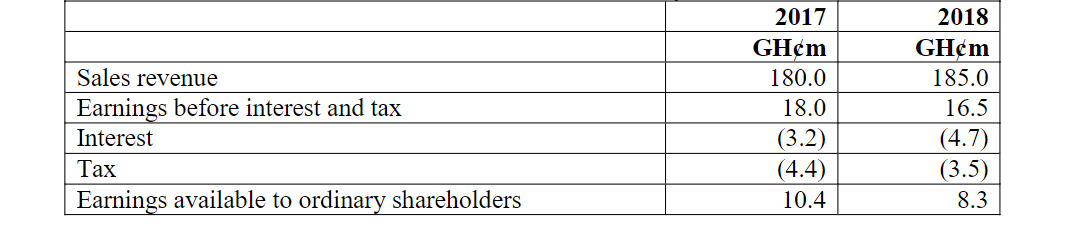
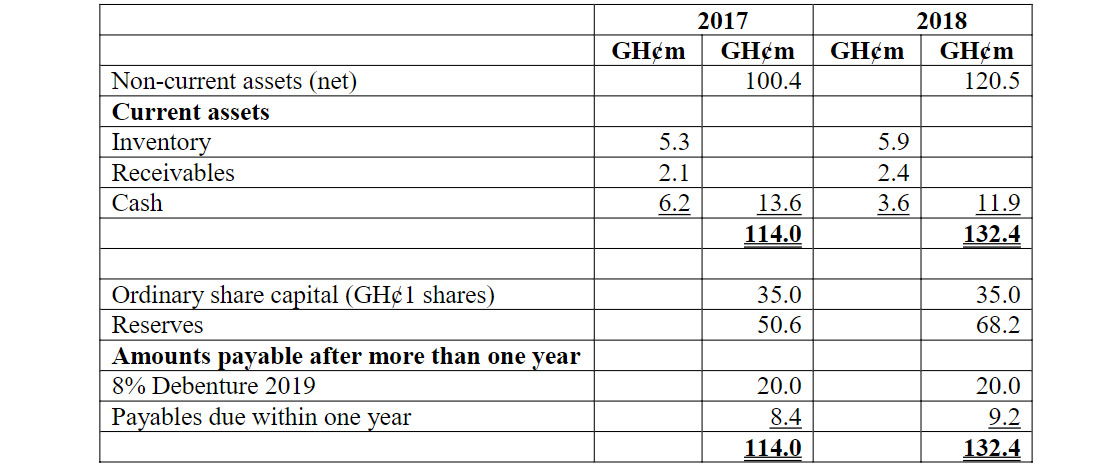
Summarized financial results for GRAT Authority for the last two years are given below:
Extracts of Statement of Profit or Loss account for the year ended 31 December
Statement of Financial Position as at 31 December
Required:
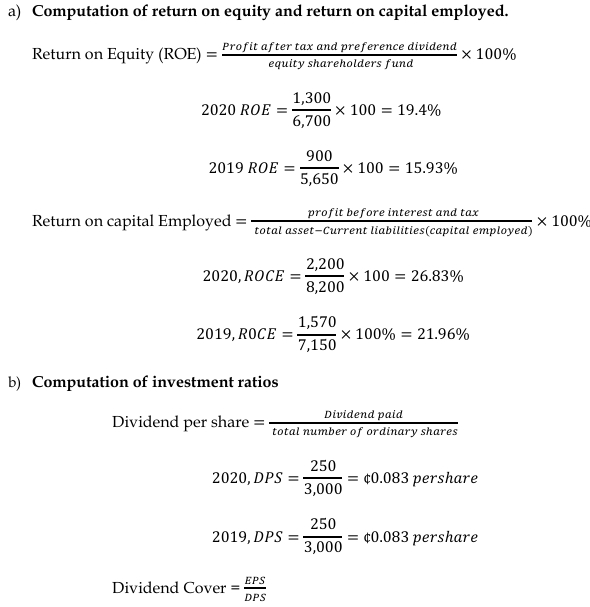
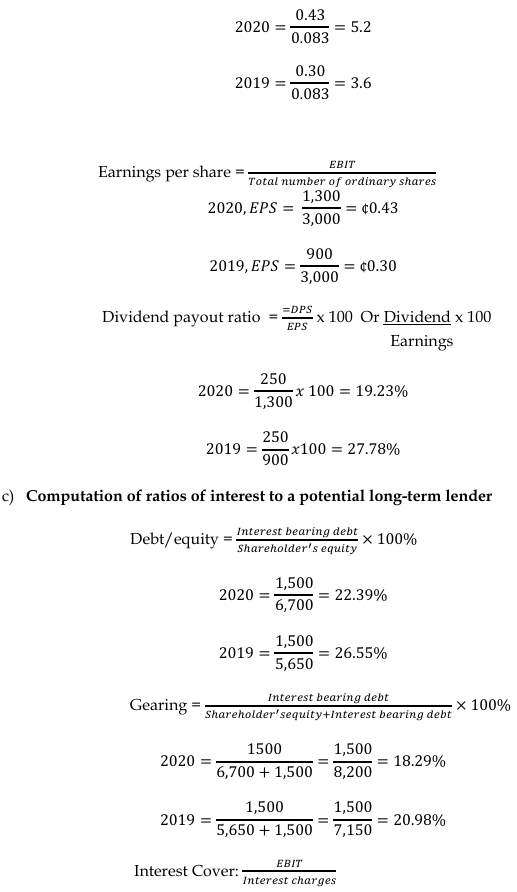
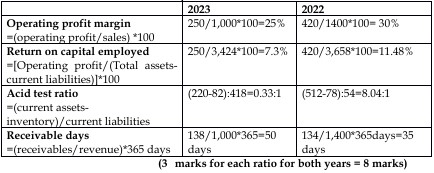
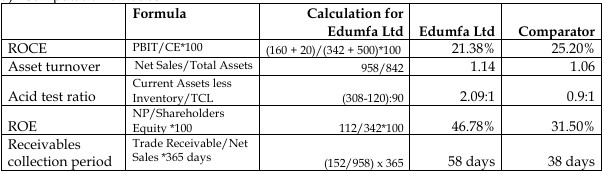
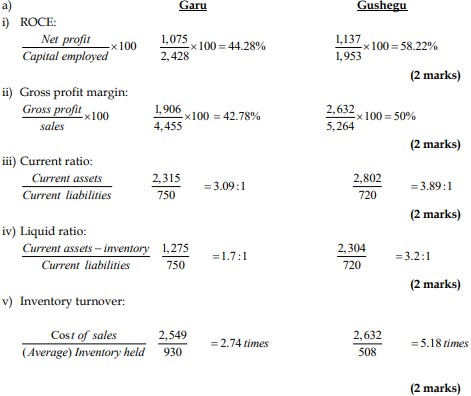
a) Calculate the following ratios for GRAT Authority for 2017 and 2018, clearly showing your workings.
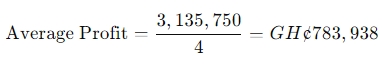
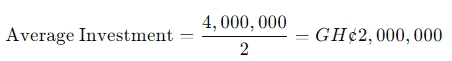
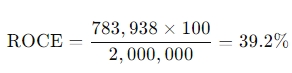
i) Return on capital employed (ROCE)
ii) Net profit margin
iii) Asset turnover
iv) Current ratio
b) Evaluate the financial performance of the entity in 2017 and 2018 as revealed by the above ratios.
c) Suggest THREE (3) non-financial indicators that could be useful in measuring the performance of a passenger railway service and explain why your chosen indicators are important.
d) Explain the term short-termism and suggest ways in which a long-term view can be encouraged.
(Total: 20 marks)
Answer
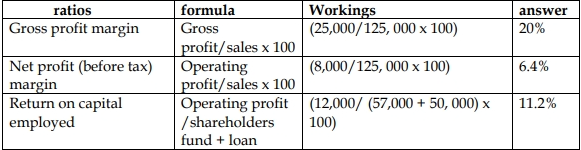
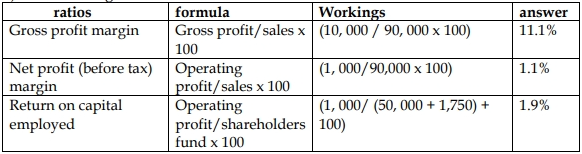
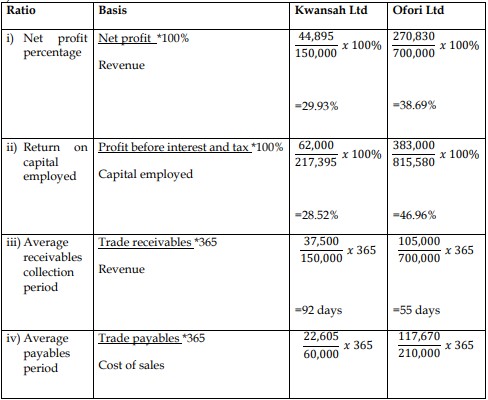
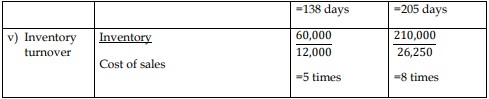
a) Financial ratios
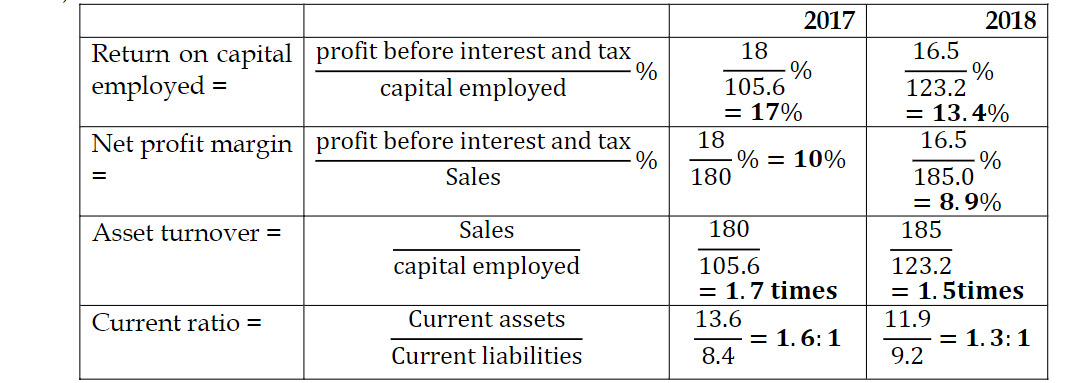
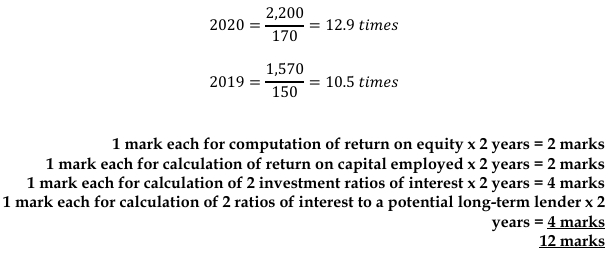
(2 marks each for every ratio calculated = 8 marks)
b) Profitability
- Return on capital employed has fallen from 2017 to 2018, caused by a decrease in operating profit and an increase in capital employed. The fall in operating profit may have been caused by an increase in costs, while the new investment program will have caused an increase in capital employed.
- Asset turnover has fallen. Sales have only increased by 2.8% between 2017 and 2018, so the new investment program may not yet have had a significant effect on sales.
- In the short term, the investment program has increased assets and costs but has not yet influenced sales.
- Liquidity: The current ratio has deteriorated, so the firm’s ability to meet its short-term obligations from its short-term resources has been reduced. The expenditure on the investment program may have decreased the cash balance between 2017 and 2018, causing the deterioration in liquidity.
(4 marks)
(2 marks)
c)
d) Short-termism is when there is a bias toward short-term rather than long-term performance.
Steps that could be taken to encourage managers to take a long-term view include:
- Making short-term targets realistic. If budget targets are unrealistically tough, a manager will be forced to make trade-offs between the short and long term.
- Providing sufficient management information to allow managers to see what trade-offs they are making.
- Evaluating managers’ performance in terms of contribution to long-term objectives.
- Linking managers’ rewards to share price to encourage goal congruence.
- Setting quality-based targets as well as financial targets.
(Any 2 points for 2 marks)