Question Tag: Ratio Analysis

Search 500 + past questions and counting.
Professional Bodies Filter
Program Filters
Subject Filters
More
Tags Filter
More
Check Box – Levels
Series Filter
More
Topics Filter
More

GRAT Authority operates passenger railway services and is responsible for the maintenance of track signaling equipment, and other facilities such as stations. In recent years it has been criticized for providing poor services to the traveling public in terms of punctuality, safety, and the standard of facilities offered to passengers. Last year, GRAT Authority invested over GH¢20 million in new carriages, station facilities, and track maintenance programs in an attempt to address these criticisms.

Summarized financial results for GRAT Authority for the last two years are given below:

Extracts of Statement of Profit or Loss account for the year ended 31 December

Statement of Financial Position as at 31 December
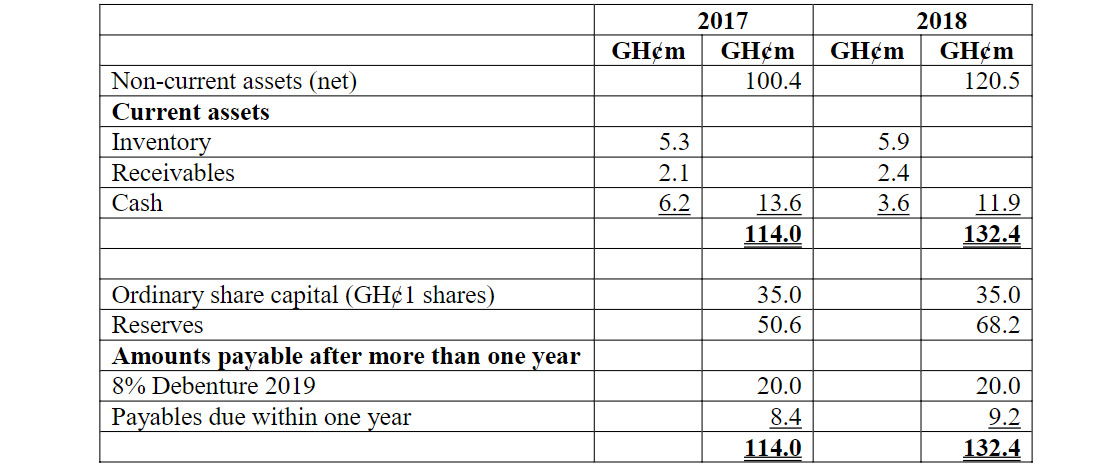
Required:

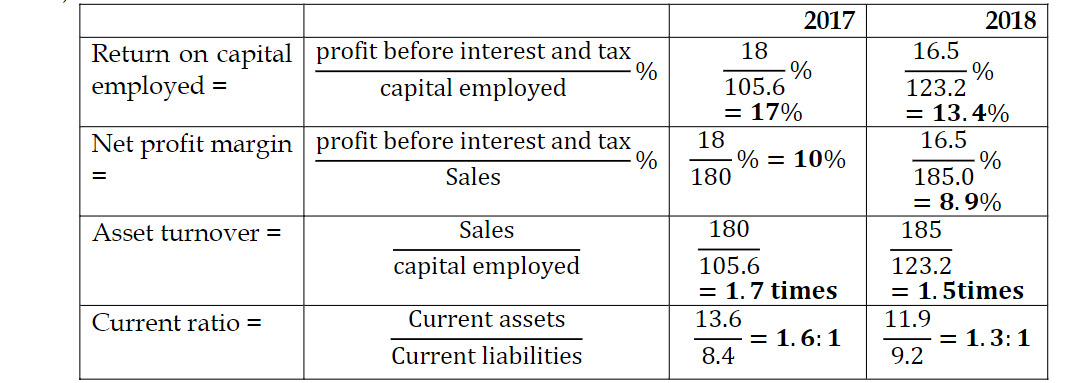
a) Calculate the following ratios for GRAT Authority for 2017 and 2018, clearly showing your workings.

i) Return on capital employed (ROCE)
ii) Net profit margin
iii) Asset turnover
iv) Current ratio

b) Evaluate the financial performance of the entity in 2017 and 2018 as revealed by the above ratios.

c) Suggest THREE (3) non-financial indicators that could be useful in measuring the performance of a passenger railway service and explain why your chosen indicators are important.

d) Explain the term short-termism and suggest ways in which a long-term view can be encouraged.
(Total: 20 marks)

a) Financial ratios

(2 marks each for every ratio calculated = 8 marks)

b) Profitability

  • Return on capital employed has fallen from 2017 to 2018, caused by a decrease in operating profit and an increase in capital employed. The fall in operating profit may have been caused by an increase in costs, while the new investment program will have caused an increase in capital employed.
  • Asset turnover has fallen. Sales have only increased by 2.8% between 2017 and 2018, so the new investment program may not yet have had a significant effect on sales.
  • In the short term, the investment program has increased assets and costs but has not yet influenced sales.
  • (4 marks)

  • Liquidity: The current ratio has deteriorated, so the firm’s ability to meet its short-term obligations from its short-term resources has been reduced. The expenditure on the investment program may have decreased the cash balance between 2017 and 2018, causing the deterioration in liquidity.

(2 marks)

c)

d) Short-termism is when there is a bias toward short-term rather than long-term performance.
Steps that could be taken to encourage managers to take a long-term view include:

  • Making short-term targets realistic. If budget targets are unrealistically tough, a manager will be forced to make trade-offs between the short and long term.
  • Providing sufficient management information to allow managers to see what trade-offs they are making.
  • Evaluating managers’ performance in terms of contribution to long-term objectives.
  • Linking managers’ rewards to share price to encourage goal congruence.
  • Setting quality-based targets as well as financial targets.

(Any 2 points for 2 marks)

You have been presented with the Financial Statements of Asiki Ltd, an audit client that has been consistent in reporting good financial performance. As part of obtaining audit evidence your Audit Manager has asked you to perform analytical procedures on the company’s General and Administrative Expenses using ratio analysis.

Required:
Explain to the Audit Manager FOUR (4) limitations of ratio analysis and how these could impact on assertions.

Limitations of ratio analysis:

  • The usefulness of ratio analysis depends on the quality of the underlying financial information, and inaccurate data can distort the results.
  • Ratios must be calculated consistently to be meaningful, as variations in calculation methods can lead to misleading comparisons.
  • The two figures used in ratio analysis must be logically related; otherwise, the resulting ratio may not provide meaningful insights.
  • A deep understanding of the client’s business is required to interpret ratios correctly, and a lack of this understanding can lead to incorrect conclusions.

As the Financial Controller of Shine Ltd, write a report to the Managing Director analyzing the performance of your company, comparing the results against that of Diamond Ltd (a key competitor) and against the industry average using the following measures:

  • Profitability
  • Liquidity
  • Gearing
  • Efficiency

To: Managing Director
From: Financial Controller
Subject: Performance Analysis for Shine Ltd – Year Ended 31 December 2016

This report provides an analysis of the financial performance of Shine Ltd compared to Diamond Ltd, our key competitor, and the industry averages using the measures of profitability, liquidity, gearing, and efficiency.

1. Profitability

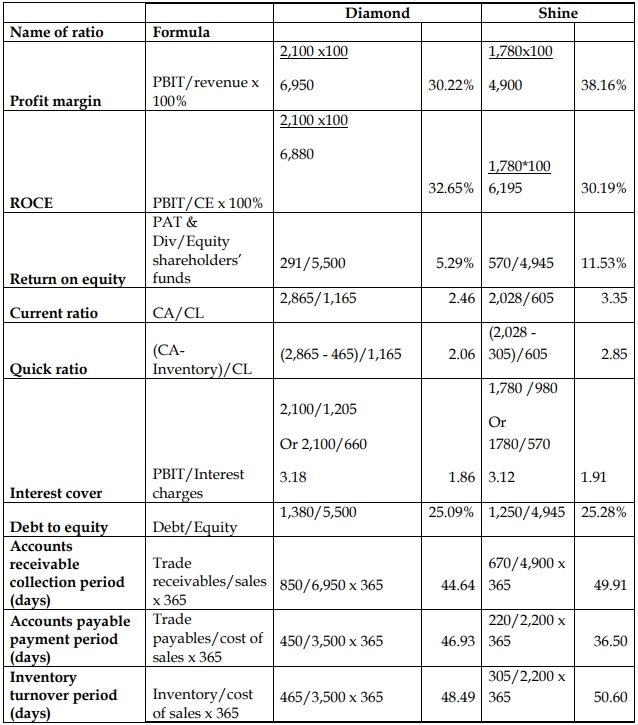
Profit Margin: Shine Ltd has a profit margin of 36.33%, which is significantly higher than Diamond Ltd’s 30.22% and also above the industry average of 35%. This indicates that Shine Ltd is more efficient in converting revenue into profit.

Return on Capital Employed (ROCE): Shine Ltd’s ROCE of 28.74% is slightly lower than Diamond Ltd’s 30.52% and below the industry average of 30%. This suggests that Shine Ltd is not utilizing its capital as effectively as Diamond Ltd in generating returns.

Return on Equity (ROE): Shine Ltd’s ROE of 11.53% is more than double that of Diamond Ltd (5.29%), but it is still significantly lower than the industry average of 20%. This indicates that while Shine Ltd is outperforming Diamond Ltd, there is room for improvement in generating returns for shareholders.

2. Liquidity

Current Ratio: Shine Ltd’s current ratio of 3.35 is better than Diamond Ltd’s 2.46 and higher than the industry average of 2.50. This suggests that Shine Ltd is in a stronger position to cover its short-term obligations.

Quick Ratio: Shine Ltd’s quick ratio of 2.85 is also superior to Diamond Ltd’s 2.06 and the industry average of 2.00. This further reinforces Shine Ltd’s strong liquidity position and its ability to meet immediate liabilities without relying on inventory sales.

3. Gearing

Interest Cover: Shine Ltd’s interest cover ratio is 2.00, which is similar to Diamond Ltd’s 1.98 and marginally below the industry average of 2.50. This indicates that Shine Ltd’s ability to meet interest payments is comparable to that of Diamond Ltd, but both are below industry standards, suggesting potential pressure in covering interest expenses.

Debt to Equity Ratio: Shine Ltd’s debt to equity ratio of 25.28% is similar to Diamond Ltd’s 25.09% and much lower than the industry average of 45%. This indicates that Shine Ltd has a lower reliance on debt financing compared to the industry, which reduces financial risk.

4. Efficiency

Accounts Receivable Collection Period: Shine Ltd takes 49.91 days to collect receivables, which is longer than Diamond Ltd’s 44.64 days and the industry average of 30 days. This indicates that Shine Ltd is slower in collecting payments from customers, which could negatively impact cash flow.

Accounts Payable Payment Period: Shine Ltd takes 36.50 days to pay its suppliers, which is shorter than Diamond Ltd’s 46.93 days and the industry average of 45 days. This indicates that Shine Ltd is paying its suppliers faster than its competitor and the industry norm, which may affect its working capital management.

Inventory Turnover Period: Shine Ltd’s inventory turnover period is 50.60 days, slightly longer than Diamond Ltd’s 48.49 days and the industry average of 40 days. This indicates that Shine Ltd is holding inventory for a longer period, which could increase storage costs or risk of obsolescence.

Conclusion

Overall, Shine Ltd is performing well in terms of profitability and liquidity, outperforming Diamond Ltd and meeting or exceeding industry averages in several areas. However, there are concerns with the company’s efficiency, particularly in managing receivables and inventory. There is also a need to improve interest cover to reduce financial risk. Addressing these areas could further enhance Shine Ltd’s competitive position and financial health.

Signed:
Financial Controller

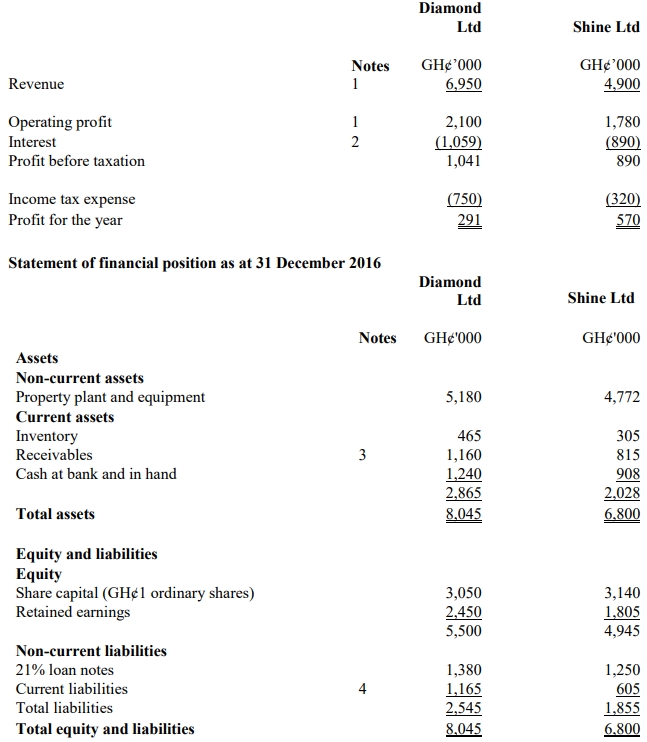
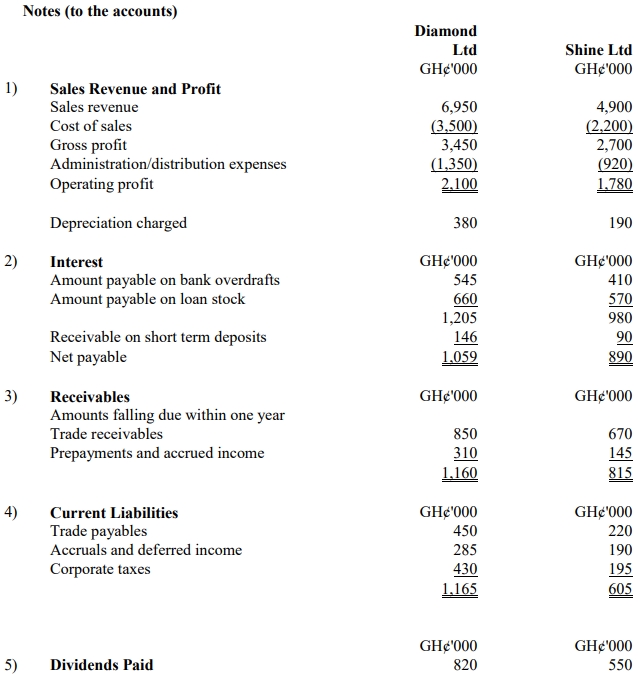
The following information has been extracted from the recently published accounts of Diamond Ltd and Shine Ltd.

Statement of Profit or Loss for the year ended 31 December 2016

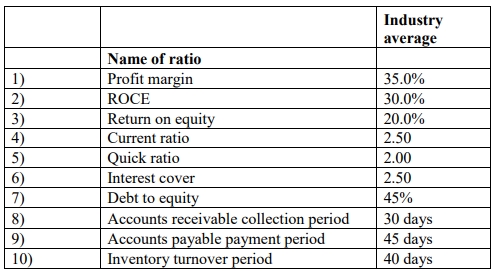
The following are the latest industry average ratios:
Required:
Calculate comparable ratios (to two decimal places where appropriate) for the two companies. All calculations must be clearly shown.

Diamond Ltd and Shine Ltd

The following information has been extracted from the Financial Statements of Mantemante Ltd.

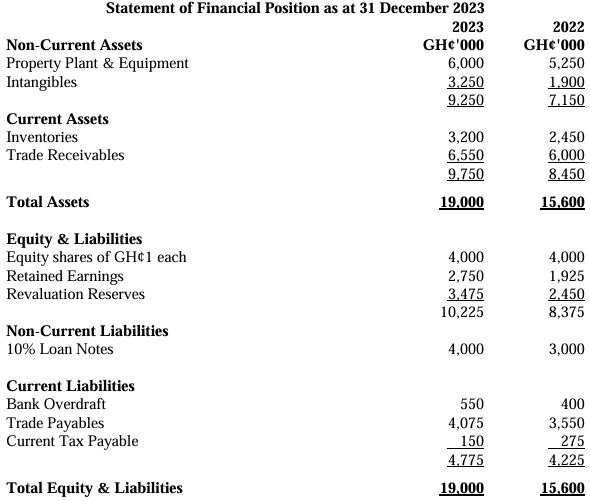
Statement of Financial Position as at 31 December 2023

Additional information, including ratios such as Return on Capital Employed, Net Profit Margin, Asset Turnover, Gearing, etc., is also provided.

Required:
a) Compute the comparable ratios for Mantemante Ltd for the years 2022 and 2023.
(10 marks)
b) Write a report for the Board of Directors analyzing the performance of Mantemante Ltd with references to the ratios for the two years and industry averages.
(10 marks)

a) Computation of Ratios

S/N Ratio 2023 2022 Industry
1 Current Ratio = Current Assets / Current Liabilities 9,750 / 4,775 = 2.04:1 8,450 / 4,225 = 2.00:1 1.94:1
2 Return on Capital Employed = PBIT / Capital Employed * 100 (2,325 + 400) / (19,000 – 4,775) * 100 = 19.16% (1,600 + 300) / (15,600 – 4,225) * 100 = 16.70% 17.60%
3 Net Profit Margin = Profit / Revenue * 100 2,325 / 56,000 * 100 = 4.04% 1,600 / 48,750 * 100 = 3.28% 3.95%
4 Total Asset Turnover = Revenue / Total Assets 56,000 / 19,000 = 2.95:1 48,750 / 15,600 = 3.13:1 3.26:1
5 Acid Test Ratio = (Current Assets – Inventories) / Current Liabilities (9,750 – 3,200) / 4,775 = 1.37:1 (8,450 – 2,450) / 4,225 = 1.42:1 1.15:1
6 Gross Profit Margin = Gross Profit / Revenue * 100 (56,000 – 42,300) / 56,000 * 100 = 24.46% (48,750 – 34,125) / 48,750 * 100 = 30.00% 33.42%
7 Receivables Collection Period = Receivables / Revenue * 365 6,550 / 56,000 * 365 = 43 days 6,000 / 48,750 * 365 = 45 days 48 days
8 Payables Payment Period = Payables / Cost of Sales * 365 4,075 / 42,300 * 365 = 35 days 3,550 / 34,125 * 365 = 40 days 42 days
9 Inventories Turnover = Cost of Sales / Inventories 42,300 / 3,200 = 13.2 times 34,125 / 2,450 = 13.93 times 16.7 times
10 Gearing = Non-Current Liabilities / (Total Assets – Current Liabilities) * 100 4,000 / (19,000 – 4,775) * 100 = 28.12% 3,000 / (15,600 – 4,225) * 100 = 26.37% 34.21%

(1 mark for each ratio = 10 marks)

b) Report to the Board of Directors

To: Board of Directors
From: Management Accountant
Subject: Analysis of Performance of Mantemante Ltd

Introduction
This report provides an analysis of the performance of Mantemante Ltd for the year ended 31 December 2023, compared to the year 2022 and the industry averages. The analysis will focus on profitability, liquidity, efficiency, and gearing ratios.

Profitability
Return on Capital Employed (ROCE) has improved significantly, moving from 16.70% in 2022 to 19.16% in 2023, surpassing the industry average of 17.60%. This suggests better utilization of capital. Similarly, the Net Profit Margin has increased to 4.04%, slightly above the industry average of 3.95%, indicating enhanced profitability. However, the Gross Profit Margin has dropped from 30% to 24.46%, below the industry average of 33.42%, which may suggest higher costs or pricing pressures.

Liquidity
The Current Ratio has improved slightly to 2.04:1, comfortably above the industry average of 1.94:1, indicating that the company can cover its short-term liabilities. The Acid Test Ratio, however, has decreased marginally to 1.37:1 but remains above the industry average of 1.15:1, indicating no immediate liquidity concerns.

Efficiency
Receivables Collection Period has remained relatively stable at 43 days, slightly better than the industry average of 48 days. The Payables Payment Period has shortened to 35 days, below the industry average of 42 days, suggesting quicker payments to suppliers, which might need review to improve cash flow management. Inventories Turnover has decreased slightly but remains lower than the industry average, indicating potential inefficiencies in managing stock levels.

Gearing
The company’s Gearing Ratio has increased marginally but remains lower than the industry average, suggesting the company has room to increase its debt if necessary.

Conclusion
Mantemante Ltd has shown improvements in profitability and liquidity over the past year. However, the decline in Gross Profit Margin and inventories turnover indicates potential areas for improvement. The company’s gearing remains conservative, leaving room for strategic financing if required.

(Total: 20 marks)

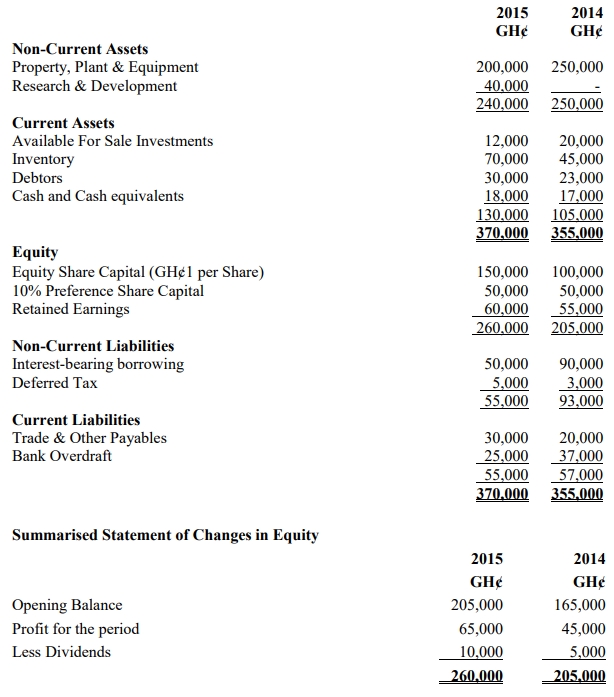
You are a private consultant for Ashtown Ltd, a listed company in Ghana operating in the manufacturing sector. Below is a Statement of Financial Position and a summarized statement of changes in equity with comparatives for the year ended 31 December 2015.

Statement of Financial Position as at 31 December 2015:

Required:
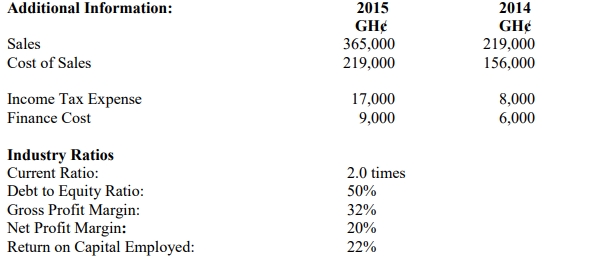
Prepare a report and address it to the Chief Executive Officer, analyzing the financial performance and financial position of Ashtown Ltd based on the industry ratios above for the years 2014 and 2015.

REPORT
To: Chief Executive Officer
From: Consultant
Date: 31 December 2015
Subject: Financial Performance and Financial Position of Ashtown Ltd for the year ending 2015

As requested, I have analyzed the financial performance and financial position of Ashtown Ltd. My analysis is based on the Statement of Financial Position, the summarized statement of changes in equity, and the additional information given. A number of key measures have been calculated and these are set out in the attached appendix.

Financial Performance

Gross Profit Margin:
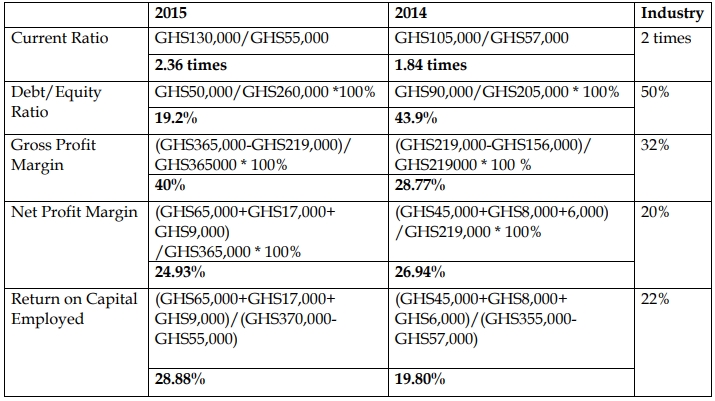
Gross profit margin measures how efficiently Ashtown Ltd generates profit from its sales after considering the cost of sales. For 2015, the gross profit margin was 40%, an improvement from 28.77% in 2014, and is higher than the industry average of 32%. This indicates better cost management or an increase in pricing.

Net Profit Margin:
Net profit margin reflects how much profit the company retains from its revenue after all expenses. In 2015, Ashtown Ltd’s net profit margin was 24.93%, which is a slight decrease from 26.94% in 2014 but still above the industry average of 20%. The company has performed better than its peers in this regard.

Return on Capital Employed (ROCE):
ROCE measures how efficiently Ashtown Ltd uses its capital to generate profit. The ROCE in 2015 was 28.88%, an increase from 19.80% in 2014, and is higher than the industry average of 22%. This indicates that the company is making efficient use of its capital and generating strong returns.

Financial Position

Current Ratio:
The current ratio measures liquidity and the ability of Ashtown Ltd to meet short-term obligations. In 2015, Ashtown Ltd’s current ratio was 2.36 times, an improvement from 1.84 times in 2014, and above the industry average of 2.0 times. This suggests that the company has strong short-term liquidity and is in a good position to cover its current liabilities.

Debt to Equity Ratio:
This ratio measures the financial leverage of the company, showing how much debt is used compared to equity. In 2015, Ashtown Ltd’s debt to equity ratio was 19.2%, down from 43.9% in 2014, which is lower than the industry average of 50%. This reflects a lower reliance on debt and improved financial stability.

Conclusion

In conclusion, Ashtown Ltd’s financial performance in 2015 has improved, especially in terms of gross profit margin and ROCE, both of which are above industry averages. The company’s liquidity and solvency positions are also favorable, with a strong current ratio and a reduced debt to equity ratio. However, the company should continue monitoring its operational costs to prevent further decline in net profit margin.

Appendix:

2015 Ratios:

Obiya Ltd assembles computer equipment from bought-in components and distributes them to various wholesalers and retailers. It has recently subscribed to an inter-firm comparison service. Members submit accounting ratios as specified by the operator of the service, and in return, members receive the average figures for each of the specified ratios taken from all of the companies in the same sector that subscribe to the service. The specified ratios and the average figures for Obiya’s sector are shown below:

Ratios of sector companies for the period to 30 September 2017

Ratio Sector Average
Return on capital employed 22.1%
Net asset turnover 1.8 times
Gross profit margin 30%
Net profit (before tax) margin 12.50%
Current ratio 1.6:1
Quick ratio 0.9:1
Inventory holding period 46 days
Accounts receivable collection period 45 days
Accounts payable payment period 55 days
Debt to equity 40%
Dividend yield 6%
Dividend cover 3 times

Obiya Ltd’s financial statements for the year to 30 September 2017 are set out below:

Statement of profit or loss for the year ended 30 September 2017

Description GH¢’000
Revenue 2,425
Cost of sales (1,870)
Gross profit 555
Other operating expenses (215)
Operating profit 340
Finance costs (34)
Exceptional item (note ii) (120)
Profit before tax 186
Income tax (90)
Profit for the period 96

Statement of changes in equity (extract)
For the year ended 30 September 2017

Description GH¢’000
Retained earnings – 1 October 2016 179
Net profit for the period 96
Dividends paid (Interim GH¢60,000; final GH¢30,000) (90)
Retained earnings – 30 September 2017 185

Statement of financial position as at 30 September 2017

Description GH¢’000
Non-current assets
Property, plant, equipment 540
Current assets
Inventory 275
Accounts receivable 320
Bank
Total current assets 595
Total assets 1,135
Equity
Ordinary shares (25 pesewas each) 150
Retained earnings 185
Total equity 335
Non-current liabilities
8% loan notes 300
Current liabilities
Bank overdraft 65
Trade accounts payable 350
Taxation 85
Total current liabilities 500
Total equity and liabilities 1,135

Notes:

i) The details of the non-current assets are:

Description Cost (GH¢’000) Accumulated depreciation (GH¢’000) Net book value (GH¢’000)
At 30 September 2017 3,600 3,060 540

ii) The exceptional item relates to losses on the sale of a batch of computers that had become worthless due to improvements in microchip design.

iii) The market price of Obiya’s shares throughout the year averaged GH¢6.00 each.

Required:
a) Calculate the ratios for Obiya equivalent to those provided by the inter-firm comparison service.

(5 marks)

b) Write a report analyzing the operational performance, gearing, investment, and liquidity of Obiya Ltd based on a comparison with the sector averages. (10 marks)

Ratios for Obiya Ltd for the period to 30 September 2017:

Description Obiya Ltd
Return on capital employed (186 + 34 loan interest ÷ (335 + 300)) 34.6%
Net asset turnover (2,425 ÷ (335 + 300)) 3.8 times
Gross profit margin (555 ÷ 2,425 × 100) 22.9%
Net profit margin (186 ÷ 2,425 × 100) 7.7%
Current ratio (595 ÷ 500) 1.19:1
Quick ratio (320 ÷ 500) 0.64:1
Inventory holding period (275 ÷ 1,870 × 365) 54 days
Accounts receivable collection period (320 ÷ 2,425 × 365) 48 days
Accounts payable payment period (350 ÷ 1,870 × 365) 68 days
Debt to equity (300 ÷ 335 × 100) 90%
Dividend yield (15p ÷ GH¢6 × 100) 2.5%
Dividend cover (96 ÷ 90) 1.07 times

(5 marks evenly spread)

b)

Report on Financial Performance of Obiya Ltd
To: Management of Obiya Ltd
From: Financial Analyst
Subject: Analysis of Financial Performance, Gearing, Investment, and Liquidity Compared to Sector Averages

1. Operational Performance:

  • Return on Capital Employed (ROCE):
    Obiya’s ROCE of 34.6% is significantly higher than the sector average of 22.1%. This indicates that Obiya is more efficient in generating profits from its capital employed. The high ROCE is largely driven by a higher Net Asset Turnover of 3.8 times compared to the sector’s 1.8 times. However, this high turnover may be partly due to the relatively old and fully depreciated non-current assets, which could require replacement soon.
  • Gross Profit Margin:
    Obiya’s gross profit margin of 22.9% is lower than the sector average of 30%. This suggests that Obiya may be facing higher cost pressures or competitive pricing challenges.
  • Net Profit Margin:
    The net profit margin of 7.7% is also below the sector average of 12.5%. The impact of the exceptional item (GH¢120,000 loss on inventory) worsens the profit margin, indicating potential issues with inventory management and technological obsolescence. Excluding this, Obiya’s profitability would improve but still remain below the sector.

2. Liquidity:

  • Current Ratio:
    Obiya’s current ratio of 1.19:1 is below the sector average of 1.6:1, indicating that the company may struggle to cover its short-term liabilities.
  • Quick Ratio:
    The quick ratio of 0.64:1 is also lower than the sector average of 0.9:1, highlighting liquidity challenges, especially if inventory becomes difficult to liquidate quickly.
  • Accounts Payable and Receivable:
    Obiya’s accounts payable payment period is 68 days, significantly higher than the sector average of 55 days, which may suggest that Obiya is taking longer to pay its suppliers. This could damage supplier relationships. The accounts receivable collection period is 48 days, which is close to the sector average of 45 days.

3. Gearing:

  • Debt to Equity:
    Obiya’s debt to equity ratio of 90% is more than double the sector average of 40%. The company is highly leveraged, which poses financial risk, especially given its lower liquidity ratios. Although the company benefits from low-interest payments (8%), the high gearing could become problematic if profitability declines further or if it struggles to meet debt obligations.

4. Investment:

  • Dividend Yield and Cover:
    Obiya’s dividend yield of 2.5% is considerably lower than the sector average of 6%. Additionally, the dividend cover of 1.07 times (compared to the sector’s 3 times) indicates that almost all the company’s earnings are being paid out as dividends, leaving little room for reinvestment or to cushion against financial difficulties. This might not be sustainable in the long run.

Conclusion:

While Obiya Ltd demonstrates strong operational efficiency in terms of asset turnover, its profitability margins are weaker compared to the sector, and it faces significant liquidity and gearing challenges. Additionally, its investment return for shareholders is below sector expectations, and the company’s dividend policy appears unsustainable. Immediate attention should be given to improving liquidity, addressing high debt levels, and managing inventory more effectively to avoid future losses.

(10 marks evenly spread)

Salt Ltd is a Government Business Entity that would like to acquire 100% of a viable private company. It has obtained the following draft financial statements for two companies, Light Ltd and Favour Ltd. They operate in the same industry, and their managements have indicated they would be receptive to a takeover.

Statement of Profit or Loss for the year ended 31 December 2017:

Description Light Ltd (GH¢’000) Favour Ltd (GH¢’000)
Revenue 12,000 20,500
Cost of sales (10,500) (18,000)
Gross profit 1,500 2,500
Operating expenses (240) (500)
Finance costs (210) (600)
Profit before tax 1,050 1,400
Income tax expense (150) (400)
Profit for the year 900 1,000
Dividends paid 250 700

Statements of Financial Position as at 31 December 2017:

Description Light Ltd (GH¢’000) Favour Ltd (GH¢’000)
Assets
Non-current assets:
Freehold factory 4,400
Owned plant 5,000 2,200
Leased plant 5,300
Total non-current assets 9,400 7,500
Current assets:
Inventory 2,000 3,600
Trade receivables 2,400 3,700
Bank 600
Total current assets 5,000 7,300
Total assets 14,400 14,800
Equity and Liabilities
Equity shares of GH¢1 each 2,000 2,000
Property revaluation reserve 900
Retained earnings 2,600 800
Total equity 5,500 2,800
Non-current liabilities
Finance lease obligations 3,200
7% loan notes 3,000
10% loan notes 3,000
Deferred tax 600 100
Government grants 1,200
Total non-current liabilities 4,800 6,300
Current liabilities
Bank overdraft 1,200
Trade payables 3,100 3,800
Government grants 400
Finance lease obligations 500
Taxation 600 200
Total current liabilities 4,100 5,700
Total equity and liabilities 14,400 14,800

Notes:

i. Both companies operate from the same premises.
ii. Additional details of the two companies’ plant are:

Description Light Ltd (GH¢’000) Favour Ltd (GH¢’000)
Owned plant – Historical cost 8,000 10,000
Leased plant – Original fair value 7,500

There were no disposals of plant during the year by either company.

iii. The interest rate implicit within Favour Ltd’s finance leases is 7.5% per annum. For the purpose of calculating ROCE and gearing, all finance lease obligations are treated as long-term interest-bearing borrowings.

Required:
Assess the relative financial performance and financial position of Light Ltd and Favour Ltd for the year ended 31 December 2017 to inform the directors of Salt Ltd in their acquisition decision. Your analysis should focus on profitability, liquidity, and gearing.
(15 marks)

Appendix – Ratio Calculations

Ratio Formula Light Ltd Favour Ltd
Gross profit margin Gross profit / Revenue 12.5% 12.2%
Operating profit margin Profit before interest and tax / Revenue 10.5% 9.8%
ROCE Profit before interest and tax / (Equity + Long-term borrowings) 14.8% 21.0%
Return on equity (ROE) Profit after tax / Equity 16.4% 35.7%
Pre-tax ROE Profit before tax / Equity 19.1% 50.0%
Net asset turnover Revenue / (Total assets – Total liabilities) 2.2 times 7.3 times
Current ratio Current assets / Current liabilities 1.2:1 1.3:1
Acid test ratio (Current assets – Inventory) / Current liabilities 0.73:1 0.65:1
Interest cover Profit before interest and tax / Finance costs 6.0 times 3.3 times
Inventory holding period Inventory / Cost of sales * 365 days 70 days 73 days
Trade receivables collection period Trade receivables / Revenue * 365 days 73 days 66 days
Trade payables payment period Trade payables / Cost of sales * 365 days 108 days 77 days
Gearing ratio Long-term debt / (Long-term debt + Equity) * 100 35.3% 70.5%
Dividend cover Profit after tax / Dividends paid 3.6 times 1.4 times

Analysis of Profitability, Liquidity, and Gearing:

  • Profitability:
    Favour Ltd has a higher return on capital employed (ROCE) of 21%, compared to 14.8% for Light Ltd, driven by a more efficient use of its assets. However, Light Ltd has a slightly better operating profit margin at 10.5% versus 9.8% for Favour Ltd, indicating slightly more efficient operations despite lower overall profitability.
  • Liquidity:
    Both companies have similar liquidity ratios, but Favour Ltd has a higher current ratio (1.3:1) compared to Light Ltd (1.2:1). However, Favour Ltd’s significant bank overdraft and lower acid test ratio (0.65:1 compared to Light Ltd’s 0.73:1) may raise concerns about its short-term financial stability.
  • Gearing:
    Favour Ltd’s gearing is much higher at 70.5% compared to Light Ltd’s 35.3%, indicating a higher reliance on debt financing. Favour Ltd’s interest cover is also lower at 3.3 times compared to Light Ltd’s 6 times, suggesting higher financial risk for Favour Ltd in terms of meeting its interest obligations.

Conclusion:
While Favour Ltd shows better profitability and asset utilization, its high gearing and reliance on debt make it a riskier investment compared to Light Ltd, which has more stable liquidity and lower financial risk.

(15 marks)

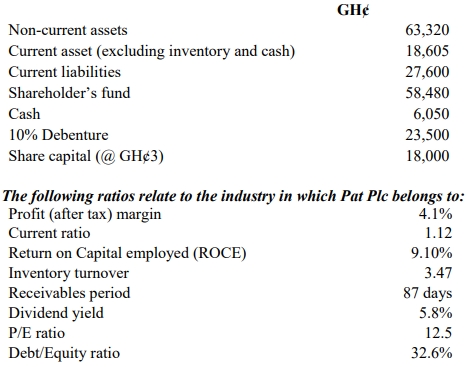
Pat Plc is a listed Ghanaian company that produces textile prints for local and African markets. During the year ended 31 March 2022, the following financial information was available:

Gross profit: GH¢12,150
Cost of sales: GH¢77,850
Operating profit before interest and tax: GH¢7,130
Finance cost: GH¢920
Tax charged to profit or loss: GH¢1,400
Inventory turnover: 3.6 times
Dividend per share: GH¢0.36
Dividend yield: 6%

Extracts from the Statement of Financial Position as at 31 March 2022:

Required:
a. Based on the information provided, compute the following ratios for Pat Plc:
i) Profit (after tax) margin
ii) Current ratio
iii) Return on Capital Employed (ROCE)
iv) Receivables period
v) Price/Earnings ratio
vi) Debt/Equity ratio

b. Using the ratios computed in Question 4a, write a report to the Board of Directors of Pat Plc assessing the financial performance and financial position of the entity, relative to its industry.

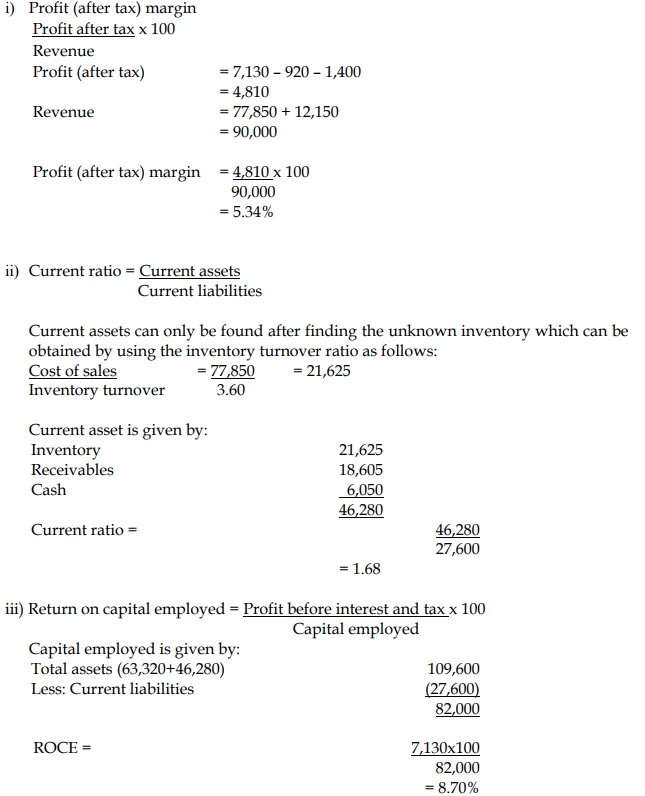
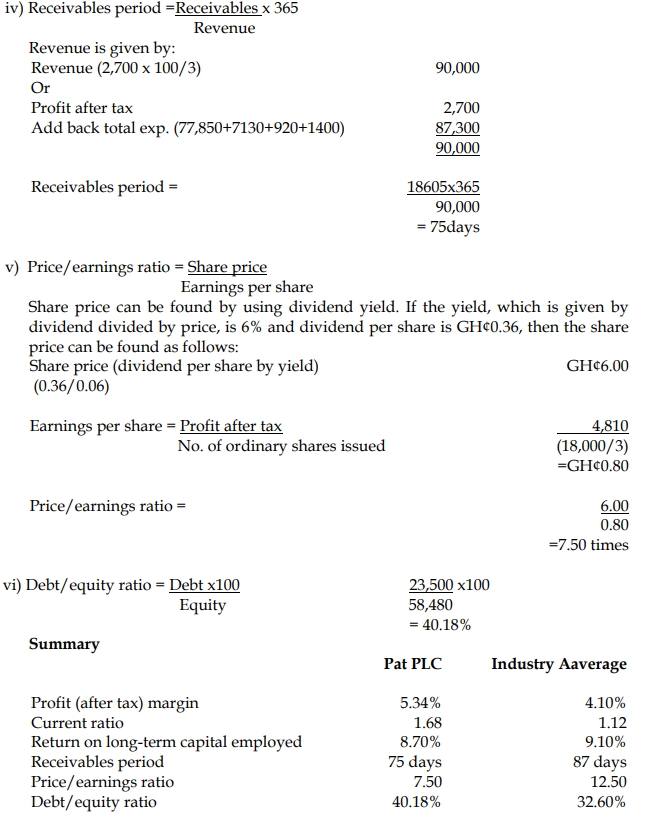
a. Computation of relevant ratios

b. Report to the Board of Directors of Pat Plc on the Financial Performance and Position

To: Board of Directors, Pat Plc
From: Financial Analyst
Date: August 2022
Subject: Assessment of Financial Performance and Position of Pat Plc

This report provides an assessment of the financial performance and financial position of Pat Plc, comparing the company’s key financial ratios with the industry averages.

Profitability:

The profit after tax margin for Pat Plc is 5.34%, which is higher than the industry average of 4.1%. This suggests that the company is generating better returns on its revenue compared to its competitors. This indicates efficient management of costs and expenses, leading to higher profitability.

However, the Return on Capital Employed (ROCE) for Pat Plc is 8.7%, slightly below the industry average of 9.1%. This indicates that while the company is profitable, it is not utilizing its capital as efficiently as its peers. Improving capital efficiency could lead to better overall returns for the company.

Liquidity:

Pat Plc has a current ratio of 1.68, which is significantly higher than the industry average of 1.12. This indicates that the company is in a strong liquidity position and is better able to meet its short-term obligations compared to other companies in the industry. A higher current ratio suggests that Pat Plc has a sufficient buffer of current assets to cover its current liabilities.

Efficiency:

The receivables period for Pat Plc is 75 days, which is shorter than the industry average of 87 days. This indicates that Pat Plc is more efficient in collecting receivables from its customers than its peers, which improves its cash flow management and reduces the risk of bad debts.

Leverage (Debt/Equity Ratio):

Pat Plc’s debt/equity ratio stands at 40.18%, which is higher than the industry average of 32.6%. This indicates that Pat Plc is more leveraged compared to its peers, exposing the company to higher financial risk due to greater reliance on debt financing. While the company’s debt level is still manageable, it may want to consider reducing its leverage to avoid potential financial distress in the future, especially given its slightly lower ROCE.

Shareholder Performance:

The Price/Earnings (P/E) ratio for Pat Plc is 7.5 times, which is considerably lower than the industry average of 12.5 times. This suggests that the market has a less optimistic view of Pat Plc’s future earnings growth compared to the rest of the industry. While the company is generating decent profits, the low P/E ratio could indicate that investors are not confident in the company’s future growth prospects or are concerned about its higher debt levels.

Additionally, Pat Plc’s dividend yield of 6% is slightly above the industry average of 5.8%, suggesting that the company is providing good returns to its shareholders in the form of dividends. This is a positive signal for investors, although the low P/E ratio indicates that there may be concerns about the company’s long-term growth potential.

Conclusion:

In summary, Pat Plc is performing well in terms of profitability, liquidity, and operational efficiency compared to its industry peers. However, the company’s slightly lower ROCE and higher debt/equity ratio suggest room for improvement in capital utilization and financial risk management. The low P/E ratio also indicates potential concerns from the market about future growth, which the company should address to improve investor confidence.

Signature:
Financial Analyst

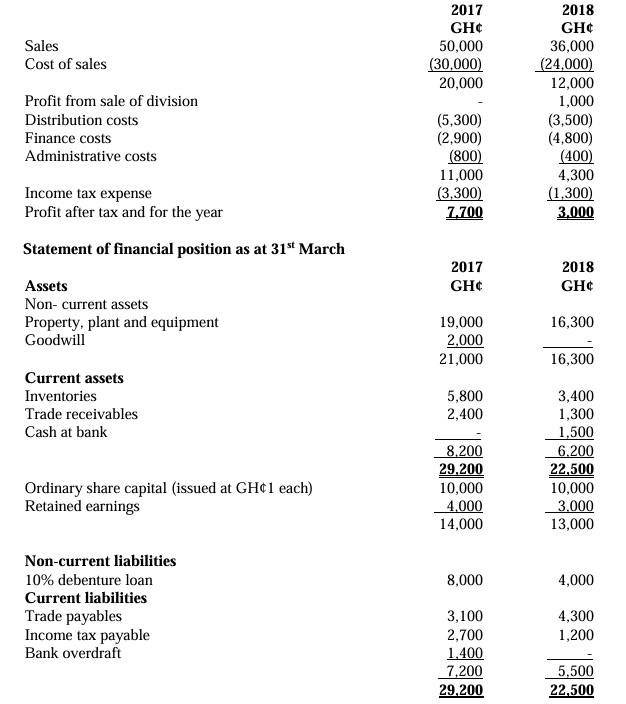
Zangi Ltd is a private company in Ghana, and extracts from its most recent financial statements are provided below:

Statement of profit or loss for the year ended 31 March:

Required:

a) Calculate the following ratios using the information in the financial statements above:

  • i) Operating profit margin
  • ii) Gross profit margin
  • iii) Return on assets employed
  • iv) Debt to equity
  • v) Interest cover
  • vi) Current ratio
  • vii) Quick ratio

b) Comment on the profitability, liquidity, and gearing of the company for the two-year periods based on the ratios computed above and advice management where appropriate.

b)

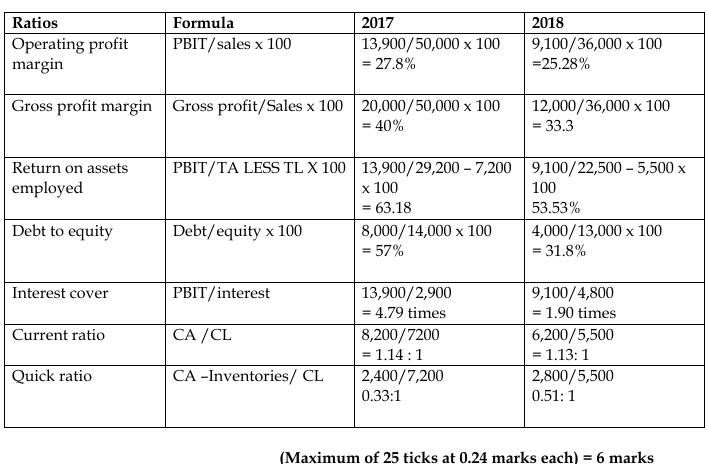
i) Profitability:

  1. Gross Profit Margin:
    • The gross profit margin declined from 40% in 2017 to 33.33% in 2018, indicating that Zangi Ltd faced either higher costs of sales relative to revenue or reduced efficiency in its operations. The reduction in sales from GH¢50,000 in 2017 to GH¢36,000 in 2018 also contributed to this decrease.
    • Recommendation: The company should explore ways to reduce costs of production or improve its pricing strategy to stabilize the gross margin.
  2. Operating Profit Margin:
    • There was a significant drop in the operating profit margin, from a positive 16.2% in 2017 to a negative 1.39% in 2018, indicating a deterioration in operational efficiency. This may have been due to an increase in finance costs and possibly higher fixed costs that the company couldn’t offset with the reduced sales revenue.
    • Recommendation: The company should review its cost structure and find ways to reduce operating costs, such as negotiating lower finance costs or optimizing administrative expenses.
  3. Return on Assets Employed (ROAE):
    • ROAE also saw a dramatic decline, from 36.82% in 2017 to a negative 2.94% in 2018. This reflects the overall inefficiency in using assets to generate profit, especially as the company reported an operating loss in 2018.
    • Recommendation: Management should focus on utilizing assets more effectively, perhaps by improving the productivity of the company’s property, plant, and equipment.

ii) Liquidity:

  1. Current Ratio:
    • The current ratio remained relatively stable, moving slightly from 1.14:1 in 2017 to 1.13:1 in 2018, indicating that Zangi Ltd has enough current assets to cover its short-term liabilities. However, the ratio is only slightly above 1, which implies that the company might face challenges if unforeseen liabilities arise.
    • Recommendation: The company should aim to improve its liquidity by generating more cash from operations, reducing its dependency on short-term liabilities, and possibly liquidating slow-moving inventory.
  2. Quick Ratio:
    • The quick ratio improved from 0.33:1 in 2017 to 0.51:1 in 2018, showing that the company’s liquidity position is getting stronger but is still low. A quick ratio of less than 1 suggests that Zangi Ltd may struggle to cover its short-term liabilities without relying on inventory sales.
    • Recommendation: The company should focus on improving its cash reserves and receivables collection processes to strengthen liquidity further. This would reduce reliance on inventory to cover immediate liabilities.

iii) Gearing:

  1. Debt to Equity Ratio:
    • Zangi Ltd’s debt-to-equity ratio improved significantly, dropping from 108.57% in 2017 to 73.08% in 2018, which is a positive trend. This reduction in gearing indicates that the company has reduced its debt burden, possibly through repayment of loans, and is now less reliant on borrowed funds.
    • Recommendation: While the improvement in gearing is commendable, Zangi Ltd should continue its efforts to reduce debt to ensure financial stability. A lower debt-to-equity ratio will also reduce interest costs, improving profitability.
  2. Interest Cover:
    • Interest cover dropped from 2.79 times in 2017 to a negative (0.10) times in 2018. This indicates that the company’s operating profit is not sufficient to cover its interest expenses, which raises a red flag regarding its ability to service its debt.
    • Recommendation: The company should explore restructuring its debt to reduce interest expenses or increase operating profit to ensure interest coverage improves.

Overall Recommendations:

  • Zangi Ltd must take measures to increase sales and control costs to improve profitability.
  • Focus on cash flow management and reducing liabilities to enhance liquidity and reduce reliance on external financing.
  • Continue to reduce gearing and find ways to enhance operating performance to regain financial stability.