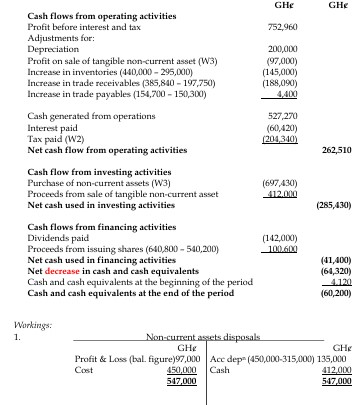
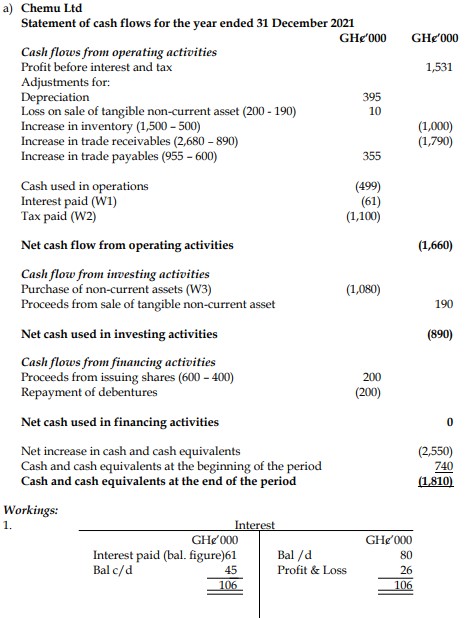
| Cash flows from operating activities |
|
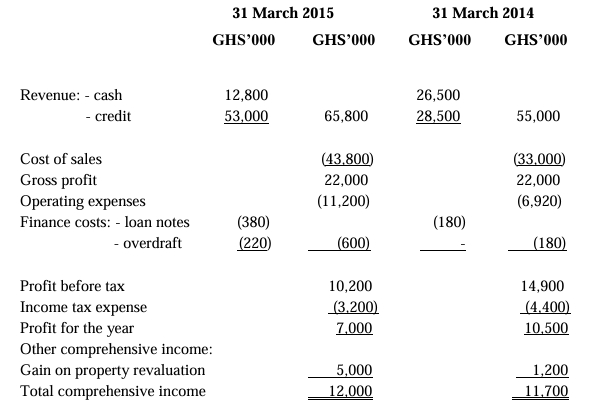
| Profit before tax |
10,200 |
| Depreciation (W2) |
6,000 |
| Loss on disposal of displays (W3) |
1,500 |
| Interest expense |
600 |
| Operating cash flow before working capital changes |
18,300 |
| Increase in warranty provision (1,000 – 300) |
700 |
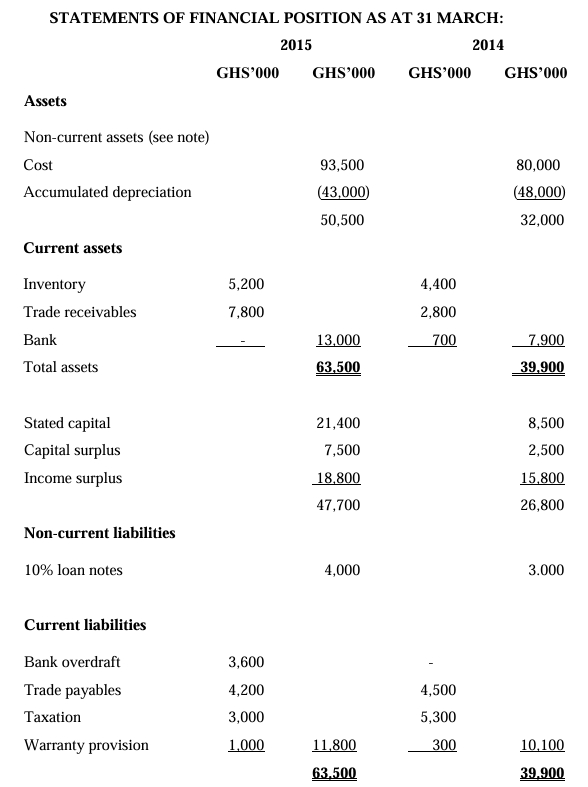
| Increase in inventories (5,200 – 4,400) |
(800) |
| Increase in receivables (7,800 – 2,800) |
(5,000) |
| Decrease in trade payables (4,500 – 4,200) |
(300) |
| Cash generated from operations |
12,900 |
| Interest paid |
(600) |
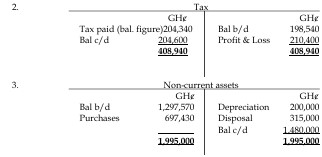
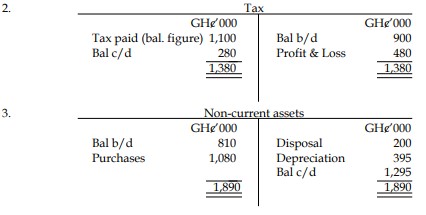
| Income tax paid (W4) |
(5,500) |
| Net cash from operating activities |
6,800 |
| Cash flows from investing activities |
|
| Purchase of property, plant, and equipment (W1) |
(20,500) |
| Cost of disposal of property, plant, and equipment |
(500) |
| Net cash used in investing activities |
(21,000) |
| Cash flows from financing activities |
|
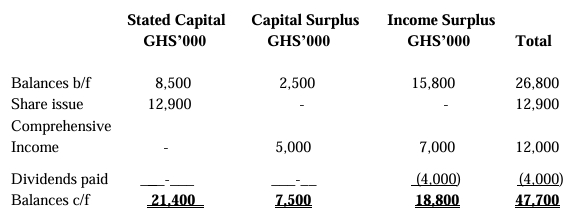
| Share issue |
12,900 |
| Loan note issue (4,000 – 3,000) |
1,000 |
| Dividends paid |
(4,000) |
| Net cash from financing activities |
9,900 |
| Net decrease in cash and cash equivalents |
(4,300) |
| Cash and cash equivalents at beginning of period |
700 |
| Cash and cash equivalents at end of period |
(3,600) |