Question Tag: Material Price Variance

Search 500 + past questions and counting.
Professional Bodies Filter
Program Filters
Subject Filters
More
Tags Filter
More
Check Box – Levels
Series Filter
More
Topics Filter
More

Slab Processes (Ghana) Limited manufactures a single product. The product is manufactured in a single process, by combining three raw materials, A, B, and C.

For 2019, the standard cost of a litre of the product was established in the budget as follows:

Material Quantity (litres) Price per litre (GH¢) Standard cost (GH¢)
A 0.7 2 1.4
B 0.4 4 1.6
C 0.1 8 0.8
Total 1.2 3.8
Loss in process -0.2
Standard cost per litre of output 1.0 3.8

During one month in the year, 2,000 litres of finished products was the output from the process, and the actual direct material costs were as follows:

Material Quantity (litres) Cost (GH¢)
A 1,340 2,970
B 910 3,450
C 240 1,900
Total 8,320

Required:

a) Calculate the material price variance and the material usage variances for the period. (5 marks)

b) Analyze the operational usage variance into a materials mix and a materials yield variance. (6 marks)

c) Comment on the significance and usefulness of a materials mix and a materials yield variance, for management control purposes. (3 marks)

d) Describe briefly THREE (3) fundamental weaknesses in the traditional annual budgeting approach that exist regardless of the budgeting method that is used. (6 marks)

(Total: 20 marks)

a) Materials usage variance

2,000 units of output: Should use (litres) Did use (litres) Usage variance (litres) Standard cost per litre (GH¢) Usage variance (GH¢)
Material A 1,400 1,340 60 (F) 2 120 (F)
Material B 800 910 110 (A) 4 440 (A)
Material C 200 240 40 (A) 8 320 (A)
Total usage variance 640 (A)

(2.5 marks)

Materials price variance

Should cost (GH¢) Did cost (GH¢) Price variance (GH¢)
1,340 litres of A 2,680 2,970
910 litres of B 3,640 3,450
240 litres of C 1,920 1,900
Total price variance

(2.5 marks)

Alternatively:
Material price variance = (SP – AP) * AQ
A: (2 – 2.216) * 1340 = 289.44 (A)
B: (4 – 3.791) * 910 = 190.19 (F)
C: (8 – 7.92) * 240 = 19.20 (F)
Total price variance: GH¢80.05 (A)

b) Mix variance

Material Actual usage (litres) Standard mix of actual total usage (litres) Mix variance (litres) Standard cost per litre (GH¢) Mix variance (GH¢)
A 1,340 1,452.5 112.5 (F) 2 225 (F)
B 910 830.0 80.0 (A) 4 320 (A)
C 240 207.5 32.5 (A) 8 260 (A)
Total mix variance 355 (A) 805 (A)

(3 marks)

Yield variance

Litres
2,000 litres of output should use (× 1.2) = 2,400
Did use = 2,490
Yield variance in litres = 90 (A)
Standard cost per litre of input (GH¢3.8 / 1.2) = 3.1667
Yield variance in GH¢ = GH¢285 (A)

(3 marks)

Alternatively:
Material yield variance:
1.2 litres of A, B & C are used to produce 1 litre.
Therefore, 2490 litres should produce 2075 litres.
But 2490 litres produced 2000 litres.
Giving a variance of 75 litres @ GH¢3.8 = GH¢285 (A)

c) A materials mix and yield variance can be useful for control purposes when several materials are mixed together in a process, and the mix of the materials is controllable by the manager responsible for the process. An adverse mix variance indicates that the mix of materials has been more expensive than the standard mix.

If the mix of materials is controllable, there is little information value in calculating the usage variance of each individual material. Instead, it is appropriate to calculate a yield variance for all the materials in total. A yield variance should be of control value, on the assumption that the quantities of materials used are controllable – for example, management should be able to control waste or scrap levels.

(3 marks)

d) The annual budget model has several inherent weaknesses. These exist no matter what approach to budgeting is used.

  • One-Year Period: The budget is for a one-year period. Targets are set for the 12 months, and actual performance is measured on the basis of achievements in one year. However, to achieve strategic change, planning needs to be for the longer term, and performance should be measured by progress towards longer-term objectives as well as shorter-term achievements. The annual budget is not compatible with longer-term planning.
  • Focus on Financial Discipline: The annual budget is also seen as a system for imposing financial discipline and control. This focus on financial targets and cost control is not compatible with setting corporate objectives, where external factors and competitiveness are just as important as internal efficiency and financial returns.
  • Internal Focus: The annual budget focuses on internal efficiency and improvements and lacks an external focus. However, strategic objectives and strategic planning have to take account of external factors as well as internal efficiency.
  • Management Time: It can be argued that the annual budget process adds little value and is unnecessary. It wastes management time, as management should be doing other things to add value and contribute to the entity’s objectives.
  • Rigid Targets: There is also an argument that the annual budget is too rigid and discourages change once the budget targets have been agreed. Management will focus their attention and efforts on achieving the agreed targets, even though circumstances might change, and the budget targets might no longer be the most appropriate.
  • Compromises: In theory, the budgeting process should help management to identify 12-month objectives that are in the best interests of the entity and that will help it to achieve its longer-term objectives. In reality, however, budgeting is often a ‘battle’ between managers for resources and status. Budget targets are often the result of negotiated compromises rather than rational decisions.

(Any 3 well-explained points @ 2 marks each = 6 marks)

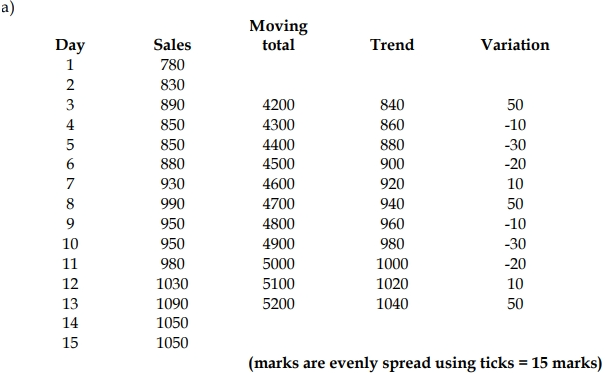
a) BB Importers Ltd has been importing electrical gadgets through the port of Takoradi over the past ten years. Management is aware that the business has been facing seasonal fluctuations but there is no scientific basis for the determination of such variations that can be used to predict future revenue. As a newly recruited Cost Accountant, you have been provided with some past daily sales performance over a three-week period. Details of the sales performance are shown below:

Sales Monday Tuesday Wednesday Thursday Friday
Week 1 780 830 890 850 850
Week 2 880 930 990 950 950
Week 3 980 1030 1090 1050 1050

Required:
Using daily moving averages, calculate the daily variation for the company. (15 marks)

b) The reasons for variances might be connected, and two or more variances may arise from the same cause. For example, a favorable variance and an adverse variance might have the same cause.

Required:
Explain the interrelationships between:
i) Material price and usage variances (2.5 marks)
ii) Labor rate and efficiency variances (2.5 marks)


b) Interrelationship between variances

  • Material price and usage variances: It may be decided to purchase cheaper
    materials for a job in order to obtain a favourable price variance. This may lead to
    higher materials wastage than expected and therefore, adverse usage variances
    occur. If the cheaper materials are more difficult to handle, there might be some
    adverse labour efficiency variance too. If a decision is made to purchase more
    expensive materials, which perhaps have a longer service life, the price variance
    will be adverse but the usage variance might be favourable. (2.5 marks)
  • Labour rate and efficiency variances: If employees in a workforce are paid higher
    rates for experience and skill, using a highly skilled team should incur an adverse
    rate variance at the same time as a favourable efficiency variance. In contrast, a
    favourable rate variance might indicate a high proportion of inexperienced
    workers in the workforce, which could result in an adverse labour efficiency
    variance and possibly an adverse materials usage variance (due to high rates of
    rejects). (2.5 marks)

a) The following data has been extracted from the books of ABC Ltd for the month of October 2023.

Date Description
2/10/2023 Bought 200 units @ GH₵100 per unit
5/10/2023 Bought 150 units @ GH₵120 per unit
8/10/2023 Issued 120 units
12/10/2023 Bought 100 units @ GH₵90 per unit
20/10/2023 Issued 140 units
24/10/2023 Bought 300 units @ GH₵150 per unit
28/10/2023 Issued 210 units

Required:
Using the FIFO method, calculate the value of the closing inventory. (10 marks)

b) Identify FOUR (4) pieces of information that can be seen on an invoice. (5 marks)

c) Preka body lotion is a product produced from the combination of two materials: prekese and kakaduro. Preka body lotion has a standard direct material cost as follows:

Material Quantity (kg) Cost per kg (GH₵) Total Cost (GH₵)
Prekese 6 15 90
Kakaduro 10 10 100

During period one, 1,000 units of Preka body lotion were manufactured, using 11,700 kilograms of prekese and 10,000 kilograms of kakaduro, costing GH₵98,600 and GH₵78,000 respectively.

Required:
Calculate the following variances for prekese and kakaduro:
i) The direct material price variance (2.5 marks)
ii) The direct material usage variance (2.5 marks)

a) ABC Ltd – Calculation of Closing Inventory Using FIFO Method

Date Receipt/Issued Balance
2/10/2023 200 @ GH₵100 200 @ GH₵100 = GH₵20,000
5/10/2023 150 @ GH₵120 200 @ GH₵100 = GH₵20,000
150 @ GH₵120 = GH₵18,000
Total = GH₵38,000
8/10/2023 Issued 120 @ GH₵100 80 @ GH₵100 = GH₵8,000
150 @ GH₵120 = GH₵18,000
Total = GH₵26,000
12/10/2023 100 @ GH₵90 80 @ GH₵100 = GH₵8,000
150 @ GH₵120 = GH₵18,000
100 @ GH₵90 = GH₵9,000
Total = GH₵35,000
20/10/2023 Issued 140 80 @ GH₵100 = GH₵8,000
60 @ GH₵120 90 @ GH₵120 = GH₵10,800
100 @ GH₵90 = GH₵9,000
Total = GH₵19,800
24/10/2023 300 @ GH₵150 90 @ GH₵120 = GH₵10,800
100 @ GH₵90 = GH₵9,000
300 @ GH₵150 = GH₵45,000
Total = GH₵64,800
28/10/2023 Issued 210 20 @ GH₵150
280 @ GH₵150 = GH₵42,000
Total = GH₵42,000

Closing Inventory:

  • 280 units @ GH₵150 per unit = GH₵42,000
    (10 marks)

b) Information That Can Be Seen on an Invoice:

  1. Payment Due Date: The date by which the payment is expected.
  2. Unique Invoice Number: A specific number that identifies the invoice.
  3. Description of Products/Services Sold: Details of what has been purchased.
  4. Quantity and Price of Each Product/Service: The amount and cost per unit of the items listed. (4 points @ 1.25 marks each = 5 marks)

c)
i) Direct Material Price Variance

Material Calculation Variance (Favorable/Adverse)
Prekese (11,700 kg × GH₵15) – GH₵98,600 GH₵76,900 Favorable (F)
Kakaduro (10,000 kg × GH₵10) – GH₵78,000 GH₵22,000 Favorable (F)

Prekese Price Variance:

  • 11,700 kg should have cost GH₵175,500, but did cost GH₵98,600
  • Variance = GH₵76,900 Favorable (F)

Kakaduro Price Variance:

  • 10,000 kg should have cost GH₵100,000, but did cost GH₵78,000
  • Variance = GH₵22,000 Favorable (F)
    (2.5 marks)

ii) Direct Material Usage Variance

Material Calculation Variance (Favorable/Adverse)
Prekese (1,000 units × 6 kg) – 11,700 kg = 5,700 kg GH₵85,500 Adverse (A)
Kakaduro (1,000 units × 10 kg) – 10,000 kg = 0 kg No Variance

Prekese Usage Variance:

  • 1,000 units should have used 6,000 kg, but did use 11,700 kg
  • Variance = 5,700 kg × GH₵15 = GH₵85,500 Adverse (A)

Kakaduro Usage Variance:

  • 1,000 units should have used 10,000 kg, but did use 10,000 kg
  • Variance = 0 kg (No Variance)
    (2.5 marks)

a) Public Sector in Ghana includes the Metropolitan, Municipal and District Assemblies
(MMDA’s) and the Ministries, Departments and Agencies (MDA’s). The private sector
dominates in terms of numbers and are significantly different in operations from the public
sector.
Required:
In reference to the above statement, explain FOUR (4) key differences between a private
sector entity and a public sector entity. (10 marks)
b) Konka Ltd produces a product – “the telescope”.
Actual results for the period were:
Production: 430 units made
Materials: 1,075 kg were used.
1,200 kg of materials were purchased at a cost of GH¢17,700
Direct labour: 1,700 hours were worked at a cost of GH¢14,637
Variable production overheads expenditure: GH¢3,870.

The standard cost card for the product is as follows:
GH¢
Direct material 2 kg x GH¢15 30
Direct labour 4hrs x GH¢8.50 34
Variable overhead 4hrs x GH¢2.00 8
The cost card is based on production and sales of 450 units in each period.
The company values its inventories at standard cost.
Required:
Calculate the following variances for Konka Ltd:
i) Material price variance
ii) Material usage variance
iii) Labour rate variance
iv) Labour efficiency variance
v) Variable overhead expenditure variance
(10 marks)

a)
Key Differences between a Private Sector Company and a Public Sector Organization:

Aspect Private Sector (Limited Company) Public Sector Organization
Ownership Shareholders The people (through the government)
Management The owners or managers appointed by owners Government appointees
Objectives To make a profit To provide a service
Funding From shareholders or borrowing from financial institutions By grants from the government
(10 marks)

b)
i) Materials Price Variance
1,200 kg of materials should cost (1,200 kg × GH¢15) = GH¢18,000
Actual cost = GH¢17,700
Materials price variance = GH¢300 Favorable (F)
(2 marks)

ii) Materials Usage Variance
430 units of output should use (430 units × 2 kg) = 860 kg
Actual usage = 1,075 kg
Materials usage variance in kg = 215 kg Adverse (A)
Standard price per kg of materials = GH¢15
Materials usage variance = 215 kg × GH¢15 = GH¢3,225 Adverse (A)
(2 marks)

iii) Labour Rate Variance
1,700 labour hours should cost (1,700 hrs × GH¢8.50) = GH¢14,450
Actual cost = GH¢14,637
Labour rate variance = GH¢187 Adverse (A)
(2 marks)

iv) Labour Efficiency Variance
430 units of output should take (430 units × 4 hrs) = 1,720 hrs
Actual hours worked = 1,700 hrs
Labour efficiency variance in hours = 20 hrs Favorable (F)
Standard rate per labour hour = GH¢8.50
Labour efficiency variance = 20 hrs × GH¢8.50 = GH¢170 Favorable (F)
(2 marks)

v) Variable Overhead Expenditure Variance
1,700 hours should cost (1,700 hrs × GH¢2) = GH¢3,400
Actual cost = GH¢3,870
Variable overhead expenditure variance = GH¢470 Adverse (A)
(2 marks)

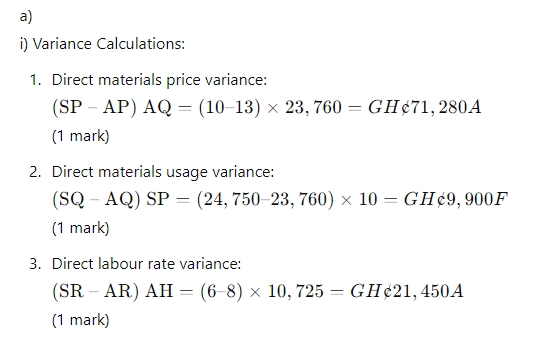
a) Magawa Ltd operates a standard variables costing system and manufactures a single product called “Magic Touch”.

The following quantities, costs and prices data have been extracted for the period just ended March 31, 2021 in respect of Magic Touch:

Standard cost card:

GH¢
Direct materials 15g at GH¢10/g = 150
Direct labour 8 hours at GH¢6/hour = 48
Variable overheads 8 hours at GH¢4/hour = 32
Standard contribution 25
Standard selling price per unit 255

Budgeted production units: 1,500

Actual results for the period ended March 31, 2021 were as follows:

Production and sales units 1,650
Selling price per unit GH¢278
Direct materials used 23,760g
Direct materials costs GH¢308,880
Direct labour hours worked 10,725
Direct labour costs GH¢85,800
Variable overheads GH¢68,000

Required: i) Compute the following variances for Magawa Ltd for the period ended March 31, 2021:

  1. Direct materials price variance. (1 mark)
  2. Direct materials usage variance. (1 mark)
  3. Direct labour rate variance. (1 mark)
  4. State ONE (1) possible reason for the material price variance calculated. (1 mark)
  5. State ONE (1) possible reason for the labour rate variance calculated. (1 mark)

b) The Valuation Department of a large firm of surveyors wishes to develop a method of predicting its total costs in a period. The following past costs and activity levels have been recorded.

Period Number of Valuations (V) Total Cost (TC) GH¢
1 420 82,200
2 515 90,275
3 425 82,900
4 500 90,000

Required: i) Derive a formula for the total cost model for a period. (4 marks) ii) Evaluate the usefulness of the high-low method. (4 marks)

c) The trend line on its own is not sufficient to make forecasts for the future. Estimates of the size of the ‘seasonal’ variation for each of the different seasons are needed. The seasonal variation is then used to adjust a forecast trend.

Required: Explain TWO (2) models used to estimate seasonal variations. (7 marks)

  1. Possible reason for the material price variance: Increase in raw material prices due to inflation or shortage of materials. (1 mark)
  2. Possible reason for the labour rate variance: Increase in wage rates due to higher demand for skilled labour or overtime payments. (1 mark)

b) i) Total cost model using high-low method:

Period V TC (GH¢)
2 515 90,275
1 420 82,200

Change in TC = 90,275 – 82,200 = 8,075 Change in V = 515 – 420 = 95 Variable cost per valuation = 8,075 / 95 = 85

Fixed cost = TC – (VC × V) Using Period 2: Fixed cost = 90,275 – (85 × 515) = 46,000

Total cost model: TC = 46,000 + 85V (4 marks)

ii) Usefulness of the high-low method:

  • Simple and Easy: The high-low method is straightforward and easy to apply for estimating fixed and variable costs.
  • Limited Data Requirement: Requires only two data points, making it useful when limited data is available.
  • Quick Estimates: Provides quick estimates of cost behavior which can be useful for preliminary analysis.
  • Potential Issues: However, it ignores data between the high and low points, potentially leading to inaccuracies if those points are not representative of normal operations. Historical data used may not reflect current conditions. (4 marks)

c) Models used to estimate seasonal variations:

  1. Additive Model:
    • Assumes that seasonal variations above and below the trend line in each cycle add up to zero.
    • Steps:
      • Calculate the difference between the moving average value and the actual historical figure for each time period.
      • Group these seasonal variations into different seasons (e.g., days of the week, months, or quarters).
      • Calculate the average of these seasonal variations for each season.
      • If the total seasonal variations for the cycle do not add up to zero, spread the difference evenly across each season.
      • The adjusted figure is the seasonal variation. (3.5 marks)
  2. Proportional (Multiplicative) Model:
    • Expresses the actual value in each season as a proportion of the trend line value.
    • Steps:
      • Calculate seasonal variations for each time period by dividing the actual data by the corresponding moving average or trend line value.
      • Sum of the proportions for each time period must add up to 1 (or the sum of proportions for quarterly data must sum to 4).
      • If the sum does not match, spread the difference evenly over each quarter to adjust the proportions. (3.5 marks)