Question Tag: Histogram

Search 500 + past questions and counting.
Professional Bodies Filter
Program Filters
Subject Filters
More
Tags Filter
More
Check Box – Levels
Series Filter
More
Topics Filter
More

BomBo, a market researcher at a major African Automobile Company (African Moon), classified households by car ownership. The relative frequencies of households for each category of ownership are shown below:

Number of Cars Per Household Relative Frequencies
0 0.10
1 0.30
2 0.40
3 0.12
4 0.06
5 0.02

Required:
(i) Calculate the expected value of the random variable. (4 marks)

(ii) Calculate the standard deviation of the random variable. (4 marks)

(iii) Draw a Relative Percentage Histogram for the data. (4 marks)

(iv) Using (i)-(iii), comment on the distribution of the data. (3 marks)

(i) Expected Value (E(X)):
The expected value is calculated as follows:

E (X) =

E (X) = (0×0.10) + (1×0.30) + (2×0.40) + (3×0.12) + (4×0.06) + (5×0.02)

E (X) = 0 + 0.30 + 0.80 + 0.36 + 0.24 + 0.10 = 1.80

Thus, the expected value of the number of cars per household is 1.80.


(ii) Standard Deviation (σ):
First, calculate the variance:

Var (X) =

       Var (X) = 0.324+0.192+0.016+0.173+0.290+0.205=1.20


Now, calculate the standard deviation:

Thus, the standard deviation is 1.095.
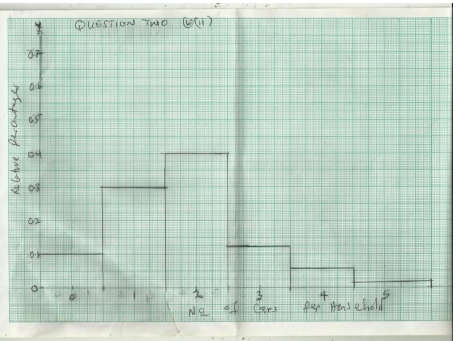
 

iii)

Relative Percentage Histogram:


(iv) Comments on the Distribution:
The distribution of car ownership is positively skewed, as the expected value (1.80) is closer to the lower end of the range, and most households own 1 or 2 cars. The data shows that only a small percentage of households own more than 3 cars, contributing to the positive skewness.

a) Explain in brief the following features of time series:
i) Trend.
ii) Seasonal variation.
iii) Random variation.
(6 marks)

b) The following table relates to sales of Emefa Ltd for a three-year period:

Year 1st Quarter (GH¢’000) 2nd Quarter (GH¢’000) 3rd Quarter (GH¢’000) 4th Quarter (GH¢’000)
Year 1 200 150 180 260
Year 2 220 190 210 280
Year 3 240 200 220 300

Required:
i) Prepare a histogram using the above sales figures. (7 marks)
ii) Describe the trend of performance of the company. (2 marks)

c) Explain the following terminologies as used in accounting for overheads in management accounting:
i) Apportionment
ii) Allocation
iii) Allotment
iv) Absorption
v) Over/(under) absorption
(5 marks)

a)
i) Trend: This refers to the long-term movement or direction in data over a period of time. It shows whether the data is generally increasing, decreasing, or remaining stable. (2 marks)

ii) Seasonal variation: These are short-term fluctuations in data that occur at regular intervals due to seasonal factors such as weather, holidays, or events. They are predictable and repeatable. (2 marks)

iii) Random variation: These are irregular, unpredictable fluctuations in data caused by unforeseen events like political changes, natural disasters, or unexpected market shifts. They do not follow a pattern. (2 marks)

ii) Sales have generally increased over the 3-year period. In the specific years, sales
for the first quarters are generally higher than the second and third quarters with
last quarter sales being the highest. From the first quarters sales decreases in the
second quarters and start to increase in the second quarters and peaks in the fourth
quarters. So the second quarters sales are the lowest with the fourth quarters being
the highest. (2 marks)
c)
i) Apportionment
The sharing of overheads between and/or among costs centres using fair and
equitable basis. For example, floor area occupied, number of employees, number
stores requisitions, etc
ii) Allocation
This refers to the assignment of overheads in whole to costs centres. That is, the
attribution of overheads in whole to particular costs centres.
iii) Allotment
This refers to the sharing of overheads using defined proportions. For example,
2:3:1, 20%: 30%: 50%.

iv) Absorption
This refers to the charging of overheads to costs units using predetermined
absorption rates.
Example, direct labour hour rate, percentage of material cost, etc.
v) Over/(under) absorption
This refers to the difference between overheads absorbed charged to production
and the actual overheads incurred. Over absorption arises where the overheads
absorbed or charged to exceed the actual overheads incurred. On the other hand,
under absorption occurs where overheads charged to production is lower than the
actual overheads incurred.
(5 marks)