Question Tag: Financial Statement Analysis

Search 500 + past questions and counting.
Professional Bodies Filter
Program Filters
Subject Filters
More
Tags Filter
More
Check Box – Levels
Series Filter
More
Topics Filter
More

Mion Ltd is a listed company in Ghana and operates many super markets in Ghana. During the year 2014, there was speculation in the financial press that the entity was likely to be a takeover target for larger companies in Ghana. A recent newspaper publication has suggested that the directors are unlikely to resist a takeover. The seven member board are all nearing retirement and all own significant minority shareholdings in the business.

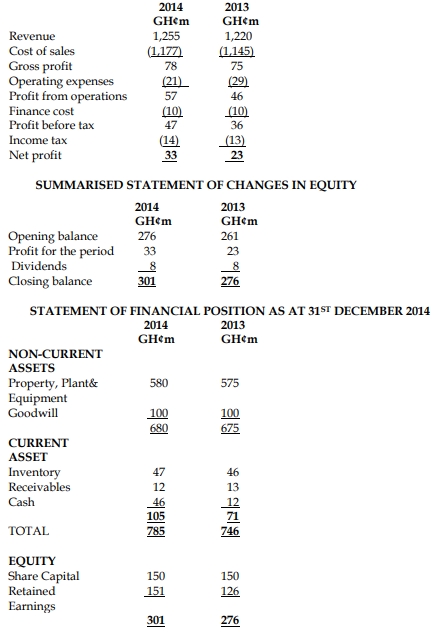
You have been approached by a private shareholder in Mion Ltd. She is concerned that the directors have conflict of interests and that financial statements for 2014 may have been manipulated. The income statement and summarized statement of changes in equity of Mion together with comparatives for the year ended 31st December 2014 and a statement of financial position as at that date are given below:

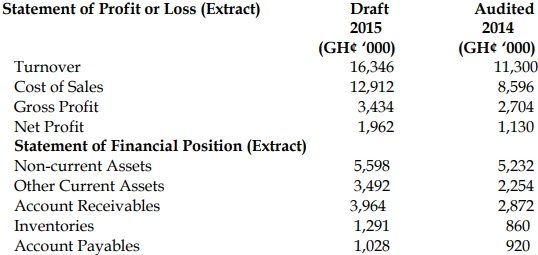
INCOME STATEMENT FOR THE YEAR ENDED 31ST DECEMBER 2014

The following additional information is relevant:

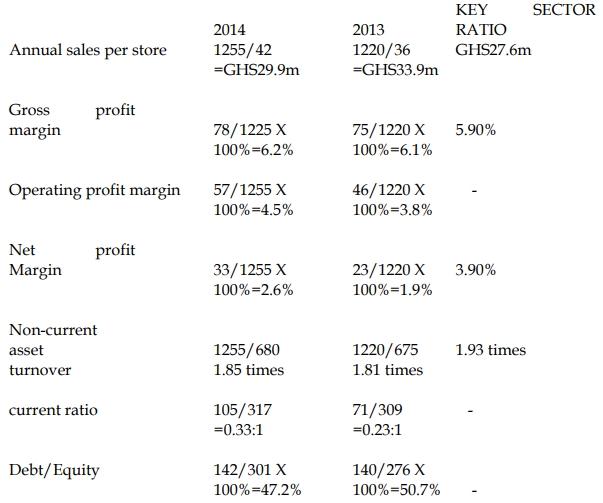
i) Non-current asset turnover (including both tangible and intangible non-current asset): 1.93 ii) Mion Ltd’s directors have undertaken a reassessment of useful lives of non-current tangible assets during the year. In most cases they estimate that the useful lives have increased and the depreciation charges in 2014 have been adjusted accordingly. iii) Six new stores have been opened during 2014, bringing the total to 42. iv) Three key ratios for the supermarket sector (based on the latest available financial statement of 12 listed entities in the sector) are as follows:

  • Annual sales per store: GH¢27.6m
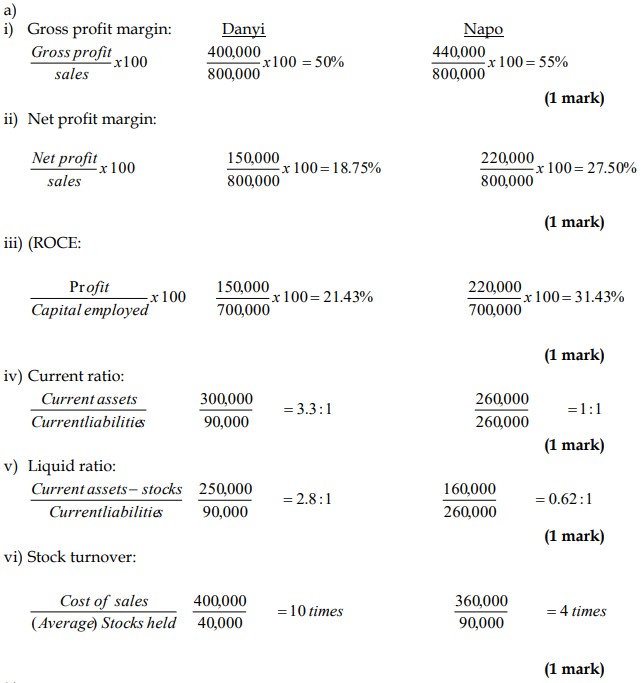
  • Gross Profit margin: 5.9%
  • Net profit margin: 3.9%

Required:
Prepare a report and address to the investor, analyzing the performance and position of Mion Ltd based on the financial statements and supplementary information provided above. The report should also include comparisons with key sector ratios, and it should address the investor’s concerns about the possible manipulation of the 2014 financial statements. (15 marks)

REPORT To: A private shareholder
From: Management accountant
Date: 31/12/2014
Subject: Performance and position of Mion

As requested, I have analyzed the performance and position of Mion. My analysis is based on extracts from the financial statements for the year ended 31 December 2014 with comparative figures for the year ended 31 December 2013. A number of key measures have been calculated and these are set out in the attached Appendix.

SALES The company has opened six new stores during the year. However, sales have only increased very slightly in 2014 and annual sales per store have fallen. This may be because the new stores have only opened part way through the year and have therefore not contributed a full year’s revenue. Alternatively, there may have been an increase in the level of sales tax.

Annual sales per store are still above the industry average. On the face of it, this is a good sign. However, it is possible that Mion has large stores relative to the rest of the sector.

PROFITABILITY Gross profit margin has increased very slightly during the year and this is a little above the industry average. However, although net profit margin has increased significantly during the year, this is still below the industry average. The increase in net profit margin has occurred because operating expenses have fallen by over a quarter in 2014. The operating profit margin has risen from 3.8% in 2013 to 4.5% in 2014.

Given the information available, the mostly likely cause of this fall is the increase in asset lives and the resulting reduction in the depreciation expense. As might be expected, the company has a considerable investment in property, plant & equipment and depreciation would normally be significant expense. An increase in asset is relatively unusual and it is possible the directors have used this method to deliberately improve the operating and the net profit margins. (They may have been particularly concerned that the net profit margin has obviously been well below the industry average.)

On the other hand, the directors may have carried out their review of assets lives in good faith or there could be another legitimate reason why operating expenses have fallen. For example, the 2013 figure may have been inflated by a significant “one off” expense.

It is impossible to prove that the profit figure has been manipulated on the basis of the very limited information available. Information about the reasons for the fall in operating expenses and review of asset lives and about the property, plant & equipment held by the company would be extremely useful.

OTHER MATTERS Non-current asset turnover has improved slightly, but still below the industry average. This suggests that the company uses its asset less efficiently than others in the same sector. However, increasing the asset lives will have reduced the ratio for 2014; it is possible that the company’s asset turnover would have approached the sector average had the review not been carried out. Given that six new stores have opened in 2014, it is surprising that property, plant & equipment has only increased by GHS5 million in the year. It is possible that most of the investment in new property was made during 2013.

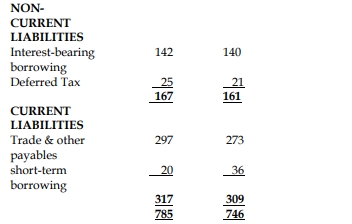
The current ratio for both years is extremely low. Supermarkets often do have relatively low current and quick ratios, but no average figure for the industry is available, so it is difficult to tell whether this is normal for the type of operation. Short-term liquidity appears not to be a problem because the company has a positive cash balance which has increased in the year. However, the appearance of the statement of financial position suggests that this has been achieved by delaying payment to suppliers. Trade and other payables have increased by nearly 9%, while revenue and cost of sales have only increased by approximately 3%.

The debt/ equity ratio has fallen in the year and gearing does not appear to be a problem.

CONCLUSION Mion’s profit margins appear to be reasonable for a company in its industry sector. Although its net profit margin is below the industry average, this is improving. There are no apparent short-term liquidity problems.

It is possible at least some of this improvement has been achieved by deliberately reducing the operating expenses for the year. If, as seems likely, the directors wish to sell their interest in the company in the near future, improved results will help to secure a better price.

However, it is impossible to be certain that this has happened without much more detailed information about the reason for the fall in operating expenses. There may be legitimate explanation for the improvement in the company’s profit margins.

APPENDIX

You are a financial consultant of Synel Investments (SI). The Directors of SI have tasked you to evaluate the financial health of two wholesaling companies – Abodam Plc (Abodam) and Bossu Plc (Bossu) – to help them decide which entity to invest in. Assume that all other factors of the two companies have been considered except their current period’s relative financial performance and position. The financial statements of Abodam and Bossu for the year ended 31 December 2022 are provided below:

Additional information:

  1. The Directors of Bossu announced at the beginning of the current period to repurchase 20% of the company’s issued shares in equal proportion over a three-year period. The purchase of the first tranche is expected to occur around February 2023. At the start of second quarter this year, the major commercial lender of Abodam triggered its covenant modification right to include stricter profit-based clauses in the loan agreement.

  1. During the year, Abodam and Bossu paid ordinary dividends of GH¢450,000 and GH¢315,000 respectively.
  2. Average borrowing rate for the two companies has remained 11% during the period.

Required:

a) Compute the following additional ratios for the two companies:

i) Return on year-end equity

ii) Return on year-end capital employed (where capital employed equals total assets less current liabilities)

iii) Trade receivables days

iv) Debt-to-equity

(8 marks)

b) Write a report to the board of SI to evaluate the relative financial performance and position of Abodam and Bossu, based on the following headings:

i) Profitability

ii) Working capital management

iii) Gearing

iv) Earnings per share

v) Bossu’s repurchase plan vi) Abodam’s loan covenant

(12 marks)

(Total: 20 marks)

b) Report

To: Board of Directors, Synel Investments From: Financial Consultant Date: 01/11/2023 Subject: Analysis of the relative financial performance and position of Abodam and Bossu

This report provides a detailed evaluation of the financial performance and position of two “investment target” entities – Abodam and Bossu for the year ended 31 December 2022. The analysis seeks to provide insight into the financial health of the two shortlisted entities to help your company decide which of them to invest in. The evaluation covers relative profitability, working capital, gearing, and earnings per share of the two entities. This report, which also reserves a space for discussing the effects of the announced repurchase plan and the modified covenants, should be read along with the attached appendix.

Profitability Profitability has to do with how well an entity deploys its resources to generate and maximize revenues in an efficient and cost-effective manner. If done well, the entity is expected to earn positive returns. In this section, I would use four metrics to gauge which of the two have been more profitable and how. The measures include gross margin, operating margin, return on capital employed, and return on equity.

Abodam’s reported gross margin of 53% sits two percentage points below that of Bossu. This seems to suggest that Bossu has better control over cost of sales. Nothing however stops any supposition from being stretched as far as to suggest that this could as well result from different pricing strategies or different classification of expenses between cost of sales and other operational expenses. This last reasoning could so soon have sufficed by the fact the operating margin takes an opposite turn; Abodam’s operating margin is noticeably higher than Bossu’s margin. Could it be that Abodam keeps more within cost of sales than within the other lines of operational costs? Whatever the answer may be, it does not prevent the fact that Abodam has better control over overall operational costs than Bossu. The former requires around 81% of revenues to attend to operational costs in entirety whereas the latter needs around 83%.

Abodam’s better margins feed seamlessly into the returns for long-term investors as well as for only equity holders. With the return on capital employed of Abodam at 24.7% against Bossu’s 21.1%, Abodam has generated more profit for providers of long-term funds, including lenders and shareholders. Equally, Abodam’s 13.07% return on equity is higher and better than Bossu’s 9.6%, and this implies that from shareholders’ perspective only, Abodam has earned more profits per every cedi of capital invested.

Working capital management Managing working capital is one activity which is very key in helping entities to not only ensure that they have appropriate level of liquidity but to also keep their operations running efficiently without sacrificing profitability. If well managed, arranging the constituents of current assets and current liabilities should lead to a good balance between liquidity and profitability. I conduct this analysis using four ratios: current ratio, inventory turnover, trade receivables days, and trade payables days.

The current ratio of Abodam compares more favourably than Bossu’s. But with both entities covering their current liabilities with current assets by more than five times, it does not make much difference that one is more liquid than the other. A look at the individual working capital items provides interesting revelations. Abodam appears to be managing inventory better but tends to be sluggish in dealing with suppliers and customers. Abodam has a slightly faster inventory turnover rate; it turns inventory over 4.6 times in a year compared to Bossu’s 4.5 times. These figures also seem to lend credence to the initial thoughts that perhaps Abodam may have employed a lower product pricing strategy to increase turnover rate. Bossu’s receivables days of 32 days against Abodam’s 37 days means that the former takes five (5) fewer calendar days to collect its debts from credit customers. In terms of managing credits received from suppliers, Bossu takes six (6) more days than Abodam before making payment to credit suppliers. These decent working capital management efforts by using fewer days to collect debts and more days to pay suppliers may be the cause of Bossu’s lower current ratio.

Gearing Gearing shows how an entity blends equity and debt in its capital structure. This relationship reveals the amount of financial risk investors will bear to create or keep financial contracts with the entity. Bossu maintains a debt-to-equity ratio of 14.96%, which is about seven (7) percentage points less than Abodam’s. Bossu’s lower gearing ratio makes it less financially risky and safer to keep investments with. But given that the operating margins of both entities edge above the average borrowing rate of 11%, it seems questionable for Bossu to have kept debt levels that low. Since debt tends to be cheaper than equity, it is prudent to use more of it especially if profit levels provide sufficient cushion to help service the legal interest payments.

Earnings per share This measures the cedi amount of profit earned on each number of issued ordinary share. It gauges an entity’s profitability from shareholders’ perspective based on number of shares held, rather than the monetary value of shareholders’ investments. In this analysis, I use two related measures: basic earnings per share and diluted earnings per share. Basic earnings per share denotes how much actual earnings is attributable to each one weighted ordinary share outstanding while diluted earnings per share refers to earnings (both actual and notional) attributable to each one weighted ordinary share, after considering both issued and dilutive potential shares.

With Abodam reporting same basic and diluted earnings per share, it simply suggests that Abodam does not have any dilutive potential shares even though it has issued some share options. What this means is that these outstanding options are not in the money; the fair value of shares is lower than the exercise price. Bossu however reports different figures for the two types, meaning that Bossu’s options are in the money and dilutive.

Based on the basic earnings per share, Bossu is considered to be more profitable than Abodam as it earns 4 pesewas more on each issued share. However, the more predictive and more useful diluted earnings per share figures put Abodam above Bossu. The higher diluted earnings per share indicates that if dilutive potential shares were assumed to have been issued at the beginning of the period or the date of issue, whichever comes later, Abodam would earn 9 pesewas more on each weighted ordinary share than Bossu. Considering possible dilution of the earnings per share helps investors to have a better view of the company’s future.

Bossu’s repurchase plan Share repurchase plans represent one popular way, often more tax-efficient than cash dividend alternative from shareholders’ point of view, used by corporate entities to return monies to shareholders while helping the buying entities to reduce the number of shares in circulation. From the company’s perspective, it may be preferable to buy back shares where management believes or ensures that the company’s shares trade at a price lower than their true value. Accounting gimmicks could play a role in ensuring that this is the case. For instance, motivated by the desire to cause share under-pricing, management could cause negative market reaction by choosing techniques, often sophisticated earnings management mechanisms, to paint less healthy financials by cutting incomes, overstating expenses, understating assets, and inflating liabilities. Bossu’s general poor show could therefore have been driven by this desire to keep share prices down and minimize the cost of the share repurchase.

Modification of Abodam’s loan covenant Debt covenant violations can be very costly for borrowing entities as failure to keep to the covenant requirements could trigger early repayment, unfavourable renegotiations, and lost credibility for future debt contracting. These covenants could be based on either accounting numbers or non-accounting numbers. Those which are related to accounting numbers broadly require the borrower to achieve and maintain strong financial performance and healthy financial position. Thus, entities have a large incentive to put measures in place to ensure that they meet these requirements in order not to invite the wrath of their lending counterparts. With the lender putting stricter clauses into the existing covenant, Abodam would be motivated to do all it can put up a good show of financial performance. While Abodam’s good performance which I have laid bare from the above analyses may be the outcome of prudent decisions, these urges to resort to biased reporting in order to meet the new covenants at all costs cannot be discounted.

Conclusion From the assessment above, I would like to suggest that Abodam is a better entity and target to proceed with as it has generally been more profitable, more liquid, and kept debts at sustainable and more prudent level. Its diluted earnings per share figure, which is more predictive and relevant, is better than that of Bossu. However, there are concerns that the good numbers could have been induced by motivation to meet the stricter covenants. Yet, until concrete evidence to that effect is tended it would be far too unjustifiable to be assuming any wrongdoing. In terms of short-term efficiency, Abodam seems to be lagging behind Bossu. But this deficiency with Abodam pales into insignificance when compared to its overall good showing.

(Signed) Financial Consultant

(2 marks for each explanation = 12 marks)

Your audit and assurance firm has just accepted a financial statement audit engagement from Lunch Special Ltd., a restaurant that prepares lunch for the general public and on special orders. The company operates at a number of sales points in the city.

The company uses a computerised system that has networked all the Sales Points to its Head Office. Your firm is planning the new audit and has received the draft financial statements for the year. As the audit senior to lead the engagement team, you are examining the financial statements, an extract of which is shown below:

Required:
i) Using analytical procedures at the planning stage, state your observations drawn from the extracts from the draft financial statements and how they may impact your audit of the Accounts Receivables. (10 marks)


The following are the observations made from the draft financial statements and their impact on the audit of the Account Receivables:

  1. Increase in Turnover:
    • Turnover has increased by 45% from the previous year, which may require verification of the sales transactions. This significant rise necessitates a closer look at the accuracy and completeness of sales records and their corresponding impact on accounts receivable.
  2. Increase in Accounts Receivable:
    • Accounts Receivable has increased by 38%, which is slightly less than the increase in turnover. This could indicate efficient collections, but it still warrants a review of the aging of receivables and potential bad debts.
  3. Reduction in Receivables Collection Period:
    • The payment period for receivables has reduced from 93 days to 89 days, which suggests improved collections. The audit should verify this by comparing receivables against cash receipts to ensure no unrecorded receipts and to detect any signs of teeming and lading.
  4. Gross Profit Margin:
    • The Gross Profit Margin has decreased from 24% to 21%, which might be a result of increased cost of sales. This decline requires further investigation into whether all sales have been appropriately recorded and whether discounts offered are properly accounted for.
  5. Reconciliation of Receivables:
    • The increase in both turnover and receivables requires confirmation of year-end balances through customer circularization and reconciliation of customer statements. Additionally, management policies on discounts and their proper recording should be verified.

The following summary information relates to two businesses, Danyi and Napo. Both businesses traded in the same market sector for the year ended 31 December 2020.

Statement of Profit or Loss Accounts for the year ended 31 December 2020:

Required:
a) Calculate the following ratios for Danyi and Napo:
i) Gross profit margin
ii) Net profit margin
iii) Return on capital employed (ROCE)
iv) Current ratio
v) Liquid (acid test) ratio
vi) Inventory turnover
(6 marks)

b) Use the ratios calculated in a) to assess:
i) The liquidity of both businesses
ii) The profitability of both businesses
(8 marks)

c) Advise management of both Danyi and Napo on the actions they should now take to improve liquidity and profitability.
(6 marks)


b)
Assessment of Liquidity and Profitability

i) Liquidity:

  • Danyi:
    Danyi has a strong liquidity position with a current ratio of 3.33:1 and a liquid ratio of 2.78:1. This suggests that Danyi has sufficient liquid assets to cover its current liabilities and is in a good position to meet short-term obligations.
  • Napo:
    Napo’s liquidity is much weaker, with a current ratio of 1.00:1 and a liquid ratio of 0.62:1. This indicates that Napo may struggle to cover its current liabilities, especially when inventory is excluded from liquid assets.

ii) Profitability:

  • Danyi:
    Danyi has a gross profit margin of 50.00% and a net profit margin of 18.75%. The ROCE of 21.43% suggests that Danyi is generating a decent return on the capital employed, though it is lower than Napo’s.
  • Napo:
    Napo demonstrates higher profitability with a gross profit margin of 55.00% and a net profit margin of 27.50%. The ROCE of 31.43% indicates that Napo is using its capital more efficiently to generate profits compared to Danyi.

(8 marks)

c)
Advice to Management

  • For Danyi:
    1. Improve Inventory Management: Danyi should consider reducing its inventory levels to further improve its liquidity and increase the efficiency of its operations.
    2. Enhance Profit Margins: Danyi may need to focus on increasing its net profit margin by either reducing operating expenses or improving sales pricing strategies.
    3. Invest Surplus Cash: Given Danyi’s strong liquidity, the management should consider investing surplus cash in revenue-generating opportunities to enhance profitability.
  • For Napo:
    1. Strengthen Liquidity: Napo should prioritize improving its liquidity by tightening credit control, collecting receivables more efficiently, and reducing reliance on bank overdrafts.
    2. Review Cost Structure: Napo should carefully review its cost structure to ensure that operating expenses do not erode profitability, particularly focusing on cost control measures.
    3. Optimize Working Capital: Napo should work towards optimizing its working capital by reducing inventory levels and improving cash flow management.

(a) Identify any FOUR users of financial statements and explain their needs for accounting information. (8 marks)
(b) The conceptual framework of accounting recognizes qualitative characteristics of financial information that is useful for decision-making.

Required:
Identify and explain FOUR qualitative characteristics of financial information recognized by the conceptual framework. (12 marks)

(a) Users of Financial Statements and Their Needs

  1. Investors: They provide risk capital, primarily as shareholders, and are concerned with the risk and return associated with their investment. Investors need information to decide whether to buy, hold, or sell shares and assess the company’s ability to pay dividends.
  2. Employees: Employees and their representatives are interested in the company’s stability and profitability. They need information to evaluate the likelihood of continued employment, potential for salary increases, retirement benefits, and career advancement opportunities.
  3. Lenders: This group includes banks, debenture holders, and other financial institutions. They require information to assess the company’s ability to repay loans and the interest due, thus determining the creditworthiness of the business.
  4. Suppliers and Trade Payables: Suppliers need to know if they will be paid on time and the company’s ongoing viability as a customer. This group is interested in information that can help them assess the company’s liquidity and credit risk.

(b) Qualitative Characteristics of Financial Information

  1. Understandability: Financial information should be presented clearly and concisely, making it accessible to users with reasonable knowledge of business and economic activities. The goal is to ensure that users can comprehend the information provided without unnecessary complexity.
  2. Relevance: Relevant information is capable of influencing users’ economic decisions by helping them evaluate past, present, or future events or confirm, or correct, their past evaluations. It includes materiality, which refers to the significance of information to decision-making.
  3. Reliability/Faithful Representation: Information is reliable when it is free from material error and bias, representing faithfully what it purports to depict. Reliable information is essential for users to trust the accuracy and integrity of financial reports.
  4. Comparability: Users must be able to compare the financial statements of an entity over time and with those of other entities. Comparability helps users identify trends and differences, thus supporting more informed decision-making.