- 15 Marks
Question
BomBo, a market researcher at a major African Automobile Company (African Moon), classified households by car ownership. The relative frequencies of households for each category of ownership are shown below:
| Number of Cars Per Household | Relative Frequencies |
|---|---|
| 0 | 0.10 |
| 1 | 0.30 |
| 2 | 0.40 |
| 3 | 0.12 |
| 4 | 0.06 |
| 5 | 0.02 |
Required:
(i) Calculate the expected value of the random variable. (4 marks)
(ii) Calculate the standard deviation of the random variable. (4 marks)
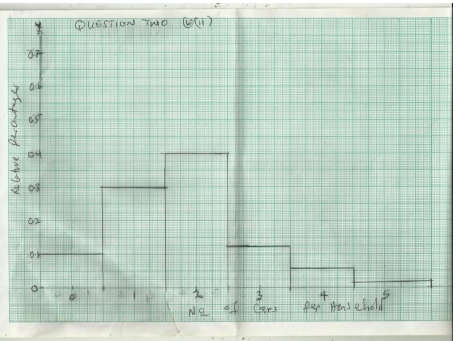
(iii) Draw a Relative Percentage Histogram for the data. (4 marks)
(iv) Using (i)-(iii), comment on the distribution of the data. (3 marks)
Answer
(i) Expected Value (E(X)):
The expected value is calculated as follows:
E (X) =![]()
E (X) = (0×0.10) + (1×0.30) + (2×0.40) + (3×0.12) + (4×0.06) + (5×0.02)
E (X) = 0 + 0.30 + 0.80 + 0.36 + 0.24 + 0.10 = 1.80
Thus, the expected value of the number of cars per household is 1.80.
(ii) Standard Deviation (σ):
First, calculate the variance:
Var (X) = ![]()
![]()
![]()
Var (X) = 0.324+0.192+0.016+0.173+0.290+0.205=1.20
Now, calculate the standard deviation: ![]()
Thus, the standard deviation is 1.095.
iii)
Relative Percentage Histogram:

(iv) Comments on the Distribution:
The distribution of car ownership is positively skewed, as the expected value (1.80) is closer to the lower end of the range, and most households own 1 or 2 cars. The data shows that only a small percentage of households own more than 3 cars, contributing to the positive skewness.
- Tags: Expected Value, Frequency Distribution, Histogram, Standard Deviation
- Level: Level 1
- Topic: Measures of Central Tendency
- Series: NOV 2018
- Uploader: Joseph
