Question
Answer
Besease Ltd
Memorandum
To: The Board of Directors
From: The Finance Manager
Date: 1/4/2022
Subject: Analysis of the performance of Besease Ltd for the year 2021
This report assesses the performance of Besease Ltd for the year ended 31 December 2021 as compared to the performance of the comparative financial year ended 31 December 2020. The company’s performance is assessed on the basis of profitability, liquidity, efficiency, and its gearing.
Profitability
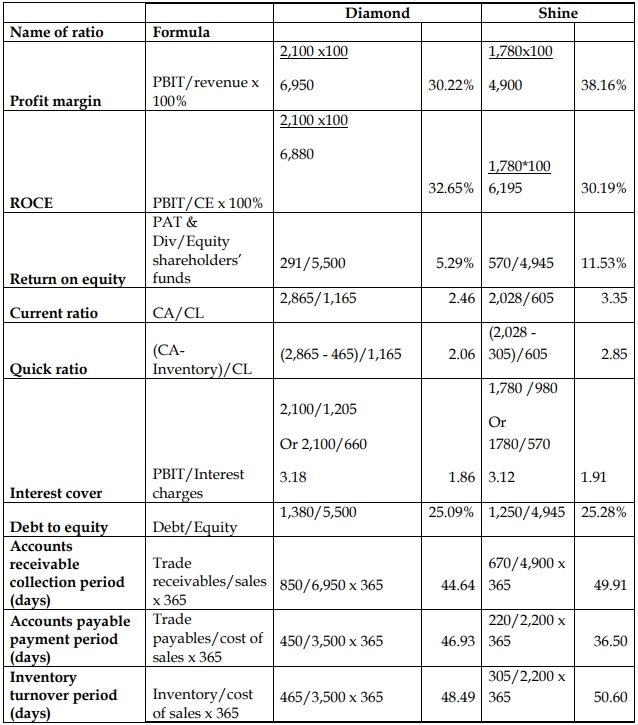
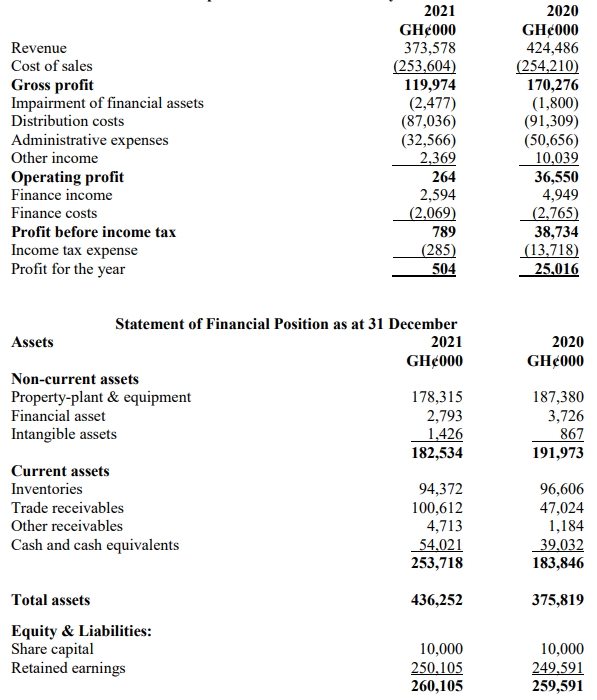
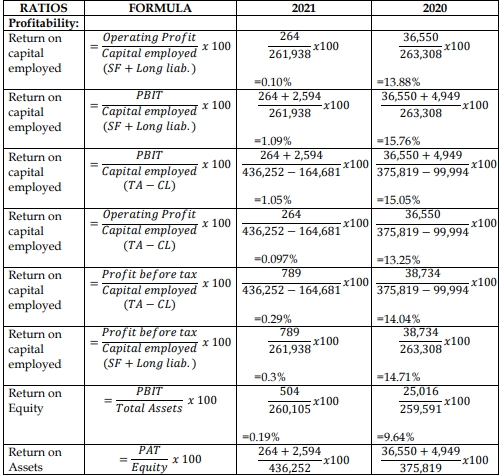
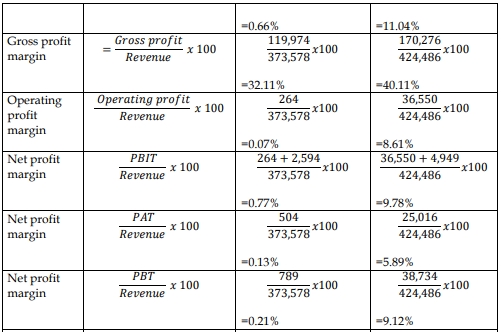
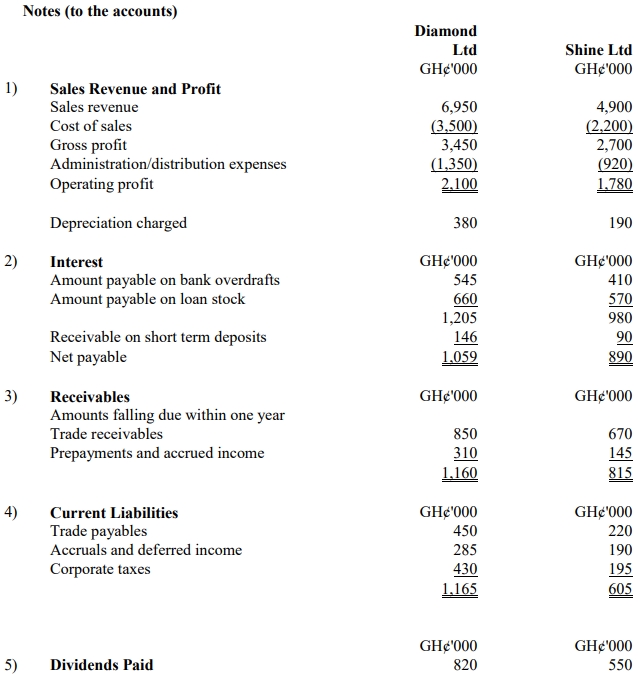
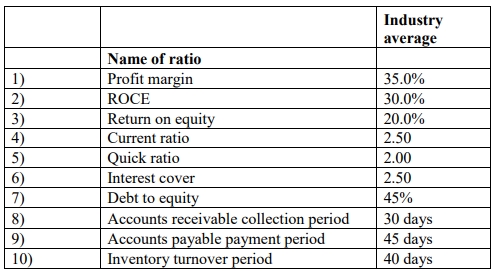
The company experienced revenue growth of 18.29% in 2021 compared to 2020. This growth led to an increase in the return on capital employed (ROCE), which rose from 7.10% in 2020 to 8.99% in 2021. This indicates that the company generated GH¢0.09 for every cedi of long-term capital employed, compared to GH¢0.07 in 2020, reflecting an improvement in profitability from the perspective of capital providers.
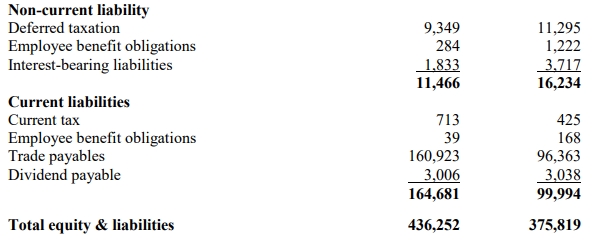
However, the return on equity (ROE), which focuses on returns to shareholders, declined from 6.84% in 2020 to 5.45% in 2021. This reduction is primarily due to the increased finance costs from loans acquired during the year. The finance cost increased by 184.16% as the company’s debt increased by 139.57%.
The company’s trading profit per cedi of revenue generated also declined in 2021 compared to 2020. In 2020, the trading profit per GH¢1 of revenue was GH¢0.44, while in 2021, it dropped to GH¢0.40. This decline suggests the company faced higher costs in 2021, with the cost of sales increasing by 25.62%, outpacing revenue growth.
Liquidity
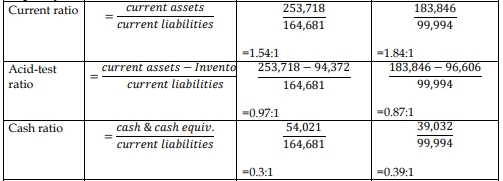
The company’s liquidity position worsened in 2021 compared to 2020, as indicated by the reduction in the acid test ratio from 0.72:1 in 2020 to 0.44:1 in 2021. This shows that the company had fewer liquid assets to cover its current liabilities, meaning its ability to settle obligations with liquid assets deteriorated. Excluding inventory from current assets, the company could only cover 44% of its short-term obligations in 2021 compared to 72% in 2020.
Efficiency
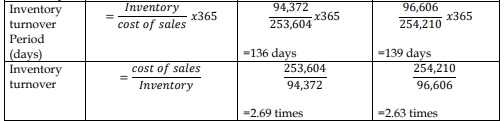
There was a decline in inventory turnover efficiency, with the average days inventory remained unsold increasing from 141 days in 2020 to 243 days in 2021. This indicates that the company took longer to sell its inventory, which is not favorable for working capital management.
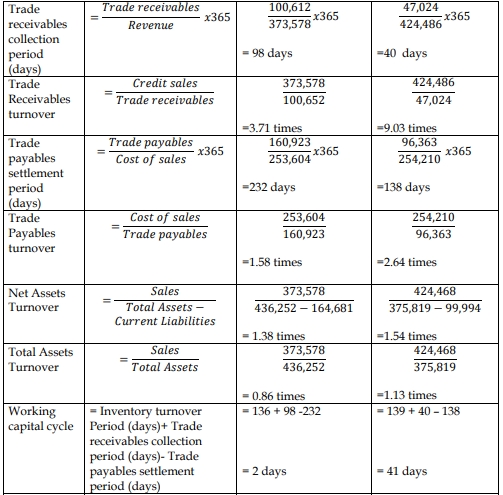
On the other hand, the company improved in collecting receivables. The average collection period for trade receivables reduced from 133 days in 2020 to 94 days in 2021. This improvement suggests the company was more effective in converting receivables into cash in 2021.
However, the company had a shorter credit period from its suppliers in 2021 compared to 2020. The trade payable days fell from 164 days in 2020 to 106 days in 2021, indicating that suppliers were being paid earlier in 2021 than in the previous year. While this may suggest better supplier relations, it could also imply less favorable credit terms and potentially more strain on cash flows.
Gearing
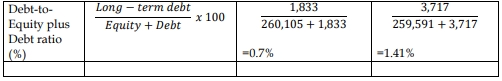
The company’s debt-to-equity ratio increased significantly from 1.13:1 in 2020 to 2.88:1 in 2021, indicating a substantial rise in financial leverage. The company is now more reliant on debt financing, increasing its financial risk.
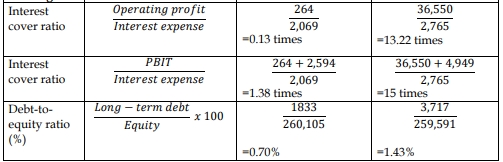
Additionally, the interest cover ratio, which measures the company’s ability to cover interest payments, decreased from 2.15 times in 2020 to 1.64 times in 2021. This suggests that the company had less profit available to cover its interest obligations in 2021, further increasing financial risk.
Conclusion
The company’s overall profitability improved in 2021, but returns for shareholders declined. Liquidity and financial risk worsened, and inventory management efficiency decreased.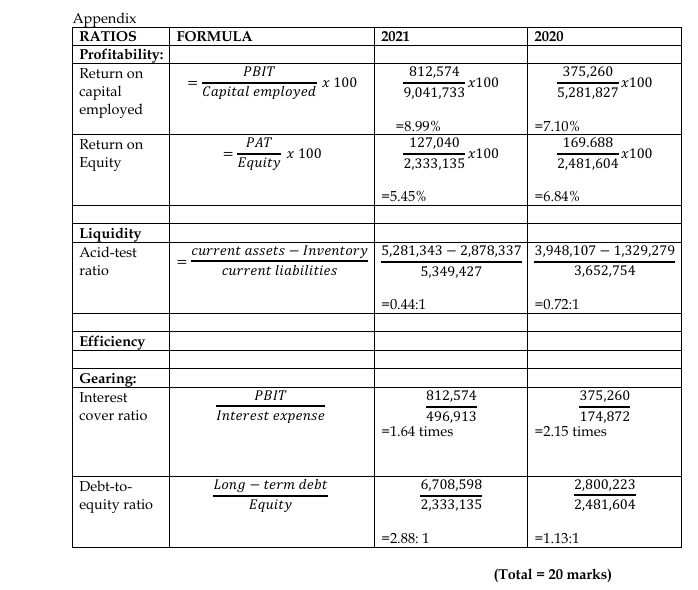
 Required: