Question Tag: Divisional Performance

Search 500 + past questions and counting.
Professional Bodies Filter
Program Filters
Subject Filters
More
Tags Filter
More
Check Box – Levels
Series Filter
More
Topics Filter
More

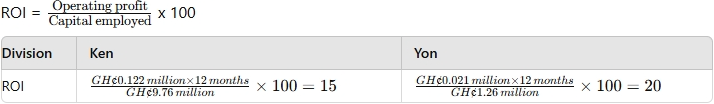
The performance bonus of the fragrance divisional manager is linked to Return on Investment (ROI) and Residual Income (RI) and has an impact on the calculation of retirement benefits. The manager is due to retire at the beginning of Year 3.

Required:
Explain why the fragrance Divisional Manager will not invest in the option showing the higher NPV and comment on whether it will be acceptable to the Board

The fragrance Divisional Manager is likely to favor Option 2, despite its lower NPV, because it yields a higher ROI and RI during the first two years. Since the manager is due to retire at the beginning of Year 3, their decision will be influenced by short-term personal interests, specifically maximizing their performance bonus and retirement benefits, which are based on ROI and RI in the first two years.

Board Perspective:
From the board’s perspective, the focus is on the long-term financial health and value creation for the company. The board would likely reject Option 2 because it underperforms in the later years and results in lower overall NPV, which does not align with the company’s objective of achieving sustainable returns exceeding 16%. Option 1, with its higher NPV, would be the better long-term choice for the company despite its lower short-term performance.

The Board of Otmost Beauty Ltd, a beauty care production company, is planning to introduce a new product. The Board has tasked the Divisional Manager of the fragrance division to evaluate two options to buy a production plant. Both options will have the same capacity and expected life of four years, but they will differ in capital costs and expected net cash flows as shown in the table below:

Option Option 1 (GH¢ million) Option 2 (GH¢ million)
Initial capital investment year 0 640 520
Net cash flows (before tax)
Year 1 240 260
Year 2 240 220
Year 3 240 150
Year 4 240 100
Net present value at 16% p.a 31.6 19.0

All divisions of the company are expected to generate pre-tax returns on divisional investments in excess of 16% per annum, which the fragrance division currently is just managing to achieve. Anything less than 16% would make the divisional managers ineligible for the annual performance bonus.

The performance bonus is linked to Return on Investment (ROI) and Residual Income (RI) and also has an impact on the calculation of retirement benefits, as the retirement benefits take into consideration the performance bonus earned during the two preceding years. The manager of the fragrance division is due to retire at the beginning of Year 3.

In calculating divisional returns, divisional assets are valued at the net book values at the beginning of the year. Depreciation is charged on a straight line basis with nil residual value.

Required:
i) Calculate the ROI and RI for years 1 to 4 and select the best option from the point of view of the fragrance division based on ROI and RI criteria.

i) Computation of ROI and RI for Option 1:

Year NBV at Beginning (GH¢m) Net Cash Flows (GH¢m) Depreciation (GH¢m) Profit (GH¢m) Imputed Interest @16% (GH¢m) Residual Income (GH¢m) ROI (%)
1 640 240 160 80 102.4 (22.4) 12.5%
2 480 240 160 80 76.8 3.2 16.7%
3 320 240 160 80 51.2 28.8 25.0%
4 160 240 160 80 25.6 54.4 50.0%

Computation of ROI and RI for Option 2:

Year NBV at Beginning (GH¢m) Net Cash Flows (GH¢m) Depreciation (GH¢m) Profit (GH¢m) Imputed Interest @16% (GH¢m) Residual Income (GH¢m) ROI (%)
1 520 260 130 130 83.2 46.8 25.0%
2 390 220 130 90 62.4 27.6 23.1%
3 260 150 130 20 41.6 (21.6) 7.7%
4 130 100 130 (30) 20.8 (50.8) (23.1%)

Conclusion:
Over the entire life of the project, both ROI and RI favor Option 1, with an average ROI of 26.05% and a cumulative RI of GH¢16 million, while Option 2 has an average ROI of 8.18% and a cumulative RI of GH¢0.5 million. Therefore, Option 1 is the best option based on both ROI and RI criteria.

State ONE (1) similarity and TWO (2) differences between a Profit centre and an Investment centre.

Similarity:

  • Both centers are responsible for effective cost minimization and maximization of profit.

Differences:

  1. An Investment center has additional responsibility for capital investments, whereas a Profit center does not handle capital investments.
  2. The performance of an Investment center is measured by return on investment (ROI) or residual income (RI), while the performance of a Profit center is measured based on controllable profit.

Ken and Yon are two divisions of a large company that operate in similar markets. The divisions are treated as investment centres, and every month each division prepares an operating statement and submits it to the parent company. Operating statements for the two divisions for October are stated below:

Operating Statements for October Ken (GH¢000) Yon (GH¢000)
Sales revenue 900 555
Variable costs 345 312
Controllable fixed costs (includes depreciation on division assets) 433 222
Uncontrollable apportioned central costs 15 5
Divisional net assets for the year 9,760 1,260

The company currently has a target return on capital of 12% per annum. However, the company believes its cost of capital is likely to rise and it is considering increasing the target return on capital. Currently, the performance of each division and the divisional management are assessed primarily based on Return on Investment (ROI) using controllable profit.

Required:

i) Calculate the annualised Return on Investment (ROI) for divisions Ken and Yon, and discuss their relative performances. (6 marks)
ii) Calculate the annualised Residual Income (RI) using controllable profit for divisions Ken and Yon, and evaluate their division’s performances. (6 marks)
iii) Using appropriate ratios, evaluate the efficiency of the two divisions. (3 marks)

i) Return on Investment (ROI):

Discussion of relative performance:

  • Division Yon has the highest return on investment (20%) in comparison to division Ken (15%).
  • Both divisions exceed the target of 12% per annum set by the parent company. However, division Ken will be at greater risk if the target return on investment is increased.
  • Both divisions are profitable and generate a positive contribution for the group.
  • In absolute terms, division Ken is larger in terms of net assets and generates greater absolute profit than division Yon.

ii) Residual Income (RI):
Residual income = Profit before interest and tax – (Capital employed × cost of capital)

Division Ken (GH¢ million) Yon (GH¢ million)
Profit before interest and tax (annualised) 1.464 0.252
Capital employed cost of capital 1.171 0.151
Residual Income 0.293 0.101

Evaluation:

  • Division Ken contributes greater wealth for the group, demonstrated by a higher residual income.
  • Residual income is superior as it accounts for the absolute size of wealth generated rather than just relative returns.

iii) Efficiency ratios:

Division Ken is more operationally efficient with lower variable costs to sales (38.3% vs 56.2% for Yon).

Compare and contrast the use of residual income and return on investment in divisional performance measurement, stating the advantages.


Contrasting Residual Income & Return on Investment

  • Return on investments is a financial ratio that measures the rate of return of a company’s investments. Companies use ROI to compare the efficiency of a number of investments. Residual income is another approach to measuring the performance of an investment. It is the net operating income an investment earns above the minimum required return on its operating assets.
  • The residual income (RI) for a division is calculated by deducting from the divisional profit an imputed interest charge, based on the investment in the division. The return on investment (ROI) is the divisional profit expressed as a percentage of the investment in the division.
  • It can be difficult to compare the percentage ROI results of divisions if their activities are very different: residual income can overcome this problem through the use of different interest rates for different divisions.
  • Rigid adherence to the need to maintain ROI in the short term can discourage managers from investing in new assets, since average divisional ROI tends to fall in the early stages of a new investment. Residual income can overcome this problem by highlighting projects which return more than the cost of capital.

Comparing Residual Income & Return on Investment

  • Both methods suffer from disadvantages in measuring the profit and the investment in a division which include: Assets must be valued consistently at historical cost or at replacement cost. Neither valuation basis is ideal.
  • Both methods use the same basic figure for profit and investment, but residual income produces an absolute measure whereas the return on investment is expressed as a percentage.
  • Divisions might use different bases to value inventory and to calculate depreciation. Any charges made for the use of head office services or allocations of head office assets to divisions are likely to be arbitrary.

Advantages of ROI & RI

  • Focus management’s attention upon earning the best profit possible on the capital (total assets) available.
  • Serve as a yardstick in measuring management’s efficiency and effectiveness in managing the company as a whole and its major divisions or departments.
  • Tie together the many phases of financial planning, sales objectives, cost control, and the profit goal.
  • Afford comparison of managerial results both internally and externally.
  • Develop a keener sense of responsibility and team effort in divisional and departmental managers by enabling them to measure and evaluate their own activities in the light of the results achieved by other managers.

When negotiated transfer prices are used in the company, the managers who are involved in the proposed transfer within the company meet to discuss the terms and conditions of the transfer. They may decide not to go through with the transfer, but if they do, they must agree to a transfer price.

Required:
Explain THREE (3) limitations of negotiated transfer prices. (3 marks)

Negotiated transfer prices suffer from the following limitations:

  • The transfer price which is the final outcome of negotiations may not be close to the transfer price that would be optimal for the organisation as a whole since it can be dependent on the negotiating skills and bargaining powers of individual managers.
  • They can lead to conflict between divisions which may necessitate the intervention of top management to mediate.
  • The measure of divisional profitability can be dependent on the negotiating skills of managers who may have unequal bargaining power.
  • They can be time-consuming for the managers involved, particularly where large numbers of transactions are involved.

(Any 3 points for 3 marks)

Ayittey Ltd is an organization with two divisions: A and B, each with its own cost and revenue streams. Each of the two divisions is classified as an Investment center. The company’s cost of capital is 12%. Historically, investment decisions have been made by calculating the return on investment (ROI). A new manager who has recently been appointed in Division A has argued that using residual income (RI) to make investment decisions would result in ‘better goal congruence’ throughout the company. The data below shows the current position of the division as at the end of 31 December, 2016:

Details of Projects Project A Project B
Capital required GH¢ 82.8 million GH¢ 40.6 million
Sales generated GH¢ 44.6 million GH¢ 21.8 million
Net Profit margin 28% 33%

The company is seeking to maximize shareholders’ wealth. Assuming that Division A acquires a more efficient asset at GH¢15 million and Division B sold one of its assets with a written down value of GH¢24 million, and profits are expected to increase and decrease by GH¢11 million and GH¢5 million for Division A and B respectively.

Required:
i) Calculate both the current Return on Investment (ROI) and Residual Income (RI) for each of the divisions. (5 marks)
ii) Calculate and comment on the effect of the decision to invest in the new asset and disposal of some assets on the current ROI and RI. (7 marks)

i) Divisional performance measurement using ROI
Division A:
ROI = Net Profit / investment x 100
= 12.49 / 82.8 x 100 = 15.085%

Division B:
ROI = Net Profit / investment x 100
= 7.194 / 40.6 x 100 = 17.72%

Divisional performance measurement using RI
Division A:

GH¢
Net Profit 12.49
Less imputed interest charge (12% @ 82.8) (9.936)
Residual Income (RI) 2.554

Division B:

GH¢
Net Profit 7.194
Less imputed interest charge (12% @ 40.6) (4.872)
Residual Income (RI) 2.322

(5 marks evenly spread using ticks)

ii) Divisional performance after the new investment
Division A:
ROI = Net Profit / investment x 100
= 23.49 / 97.8 x 100 = 24.02%

Division B:
ROI = Net Profit / investment x 100
= 2.194 / 16.6 x 100 = 13.21%

Residual Income after new investment.

A B
Income 23.49 2.194
Cost of capital 11.74 1.992
RI 11.75 0.202

(3 marks)

Comment

  • If a decision about whether to proceed with the investments is made based on ROI, it is possible that the manager of Division A will accept the new proposal whereas the manager of Division B will reject the new proposal. Prior to the new investment Division A had 15.085%, though this is a bit lower than the target rate of return of 16% while Division B had 17.72%. With the new investment Division A’s manager has an ROI of 24.02%, which is above the target rate of return, representing a 37.21% increase in the ROI of division A. Division B has an ROI of 13.21%, which is lower than the target rate of return, representing a 25.45% reduction in the ROI of Division B.
  • However, since Division B’s new ROI of 13.21% is higher than the firm’s cost of capital of 12%, accepting the new investment would encourage goal congruence and improve the firm’s overall performance. Behaviorally, Division B’s manager may not be motivated to venture into the new investment if his rewards are tied to the current level of performance. Accepting the new investment means a reduction in his incentives (bonuses).

Lamiokor and Zenator are two divisions of Tsorkor group. Lamiokor division manufactures an intermediate product known as component A which has no external market. Zenator division incorporates this intermediate product, component A, into a final product that it sells to external customers. One unit of component A is used in the production of one unit of the final product. Lamiokor has quoted a transfer price of GH¢45 for each unit of component A.

The details of monthly production costs for each division are as follows:

Lamiokor Division:

  • Variable cost: GH¢15 per Component A
  • Product Specific Fixed Cost: GH¢50,000 (Incurred only by Lamiokor division and specifically for the production of Component A)

Zenator Division:

  • Variable cost: GH¢9 per unit
  • Product Specific Fixed Cost: GH¢75,000 (Cost incurred only by Zenator when converting component A to the final product)

The relationship between monthly external customer demand and selling price of the final product is as follows:

Month Demand (Units) Selling price per Unit (GH¢)
1 1,000 120
2 3,000 100
3 4,000 90
4 5,000 80
5 6,000 67

Required:
a) Explain FOUR (4) objectives of transfer pricing.

(4 marks)

b) Based on a transfer price of GH¢45 per component A, prepare the monthly profit statement for:
i) Lamiokor Division (6 marks)
ii) Zenator Division (6 marks)
iii) Tsorkor Group (4 marks)


a) The main objectives of a transfer pricing system:

  • To achieve goal congruence. The transfer prices should be such that actions that will increase a division’s reported profit will also have the effect of increasing the company’s reported profit. This maximizes the likelihood that the division managers will act in the company’s best interests.
  • To ensure that divisional autonomy is maintained. In principle, a company’s top management could simply issue precise instructions to divisions as to what goods to transfer to each other, in what quantities, and at what prices. However, most organizations prefer allowing divisional autonomy to harness the benefits it offers.
  • To ensure that the information provided (e.g., division Profit & Loss Accounts) is useful for evaluating the economic performance of divisions and the managerial performance of division managers.
  • Minimizing global tax liability. Companies can use transfer pricing to transfer profits and costs to other divisions internally to reduce their tax burden.

b)
i) Lamiokor Division:

Month Demand (Units) Transfer Price (GH¢) Variable Cost (GH¢) Contribution/Unit (GH¢) Total Contribution (GH¢) Fixed Cost (GH¢) Profit/Loss (GH¢)
1 1,000 45 15 30 30,000 50,000 (20,000)
2 3,000 45 15 30 90,000 50,000 40,000
3 4,000 45 15 30 120,000 50,000 70,000
4 5,000 45 15 30 150,000 50,000 100,000
5 6,000 45 15 30 180,000 50,000 130,000

ii) Zenator Division:

Month Demand (Units) Selling Price (GH¢) Variable Cost (GH¢) Transfer Price (GH¢) Contribution/Unit (GH¢) Total Contribution (GH¢) Fixed Cost (GH¢) Profit/Loss (GH¢)
1 1,000 120 9 45 66 66,000 75,000 (9,000)
2 3,000 100 9 45 46 138,000 75,000 63,000
3 4,000 90 9 45 36 144,000 75,000 69,000
4 5,000 80 9 45 26 130,000 75,000 55,000
5 6,000 67 9 45 13 78,000 75,000 3,000

iii) Tsorkor Group:

Month Demand (Units) Selling Price (GH¢) Variable Cost (GH¢) Contribution/Unit (GH¢) Total Contribution (GH¢) Fixed Cost (GH¢) Profit/Loss (GH¢)
1 1,000 120 24 96 96,000 125,000 (29,000)
2 3,000 100 24 76 228,000 125,000 103,000
3 4,000 90 24 66 264,000 125,000 139,000
4 5,000 80 24 56 280,000 125,000 155,000
5 6,000 67 24 43 258,000 125,000 133,000

Alternatively:
Adding the profits from both divisions:

Month Lamiokor Profit/Loss (GH¢) Zenator Profit/Loss (GH¢) Group Profit/Loss (GH¢)
1 (20,000) (9,000) (29,000)
2 40,000 63,000 103,000
3 70,000 69,000 139,000
4 100,000 55,000 155,000
5 130,000 3,000 133,000