Question
(a) CL Ltd is a wholesaler and retailer of office furniture. Extracts from the company’s financial statements are set out below:
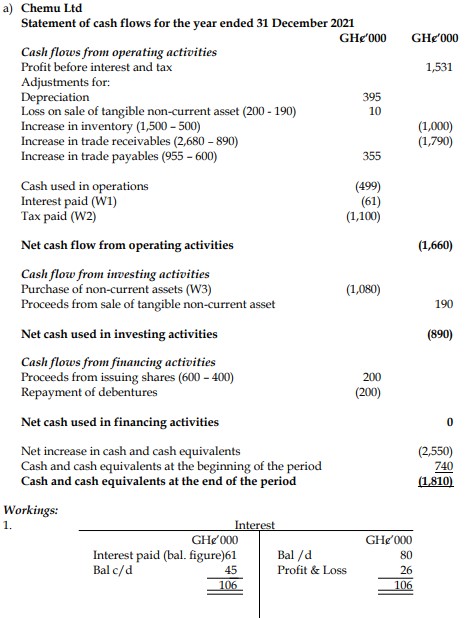
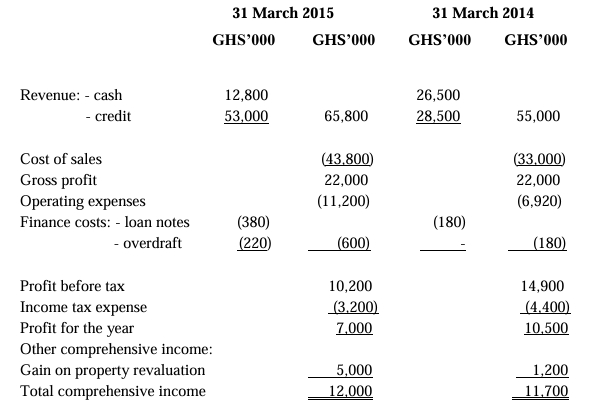
STATEMENT OF PROFIT OR LOSS AND OTHER COMPREHENSIVE INCOME
FOR THE YEAR ENDED:
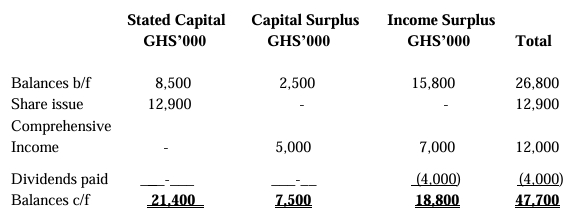
STATEMENT OF CHANGES IN EQUITY
FOR THE YEAR ENDED 31 MARCH 2015:
| Description | Stated Capital | Capital Surplus | Income Surplus | Total |
|---|---|---|---|---|
| Balances b/f | 8,500 | 2,500 | 15,800 | 26,800 |
| Share issue | 12,900 | – | – | 12,900 |
| Comprehensive income | – | 5,000 | 7,000 | 12,000 |
| Dividends paid | – | – | (4,000) | (4,000) |
| Balances c/f | 21,400 | 7,500 | 18,800 | 47,700 |
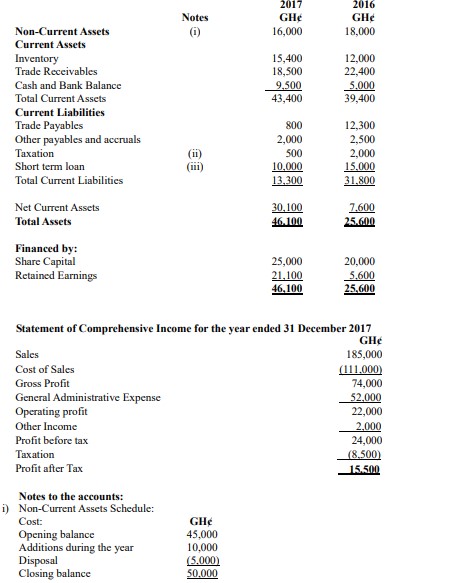
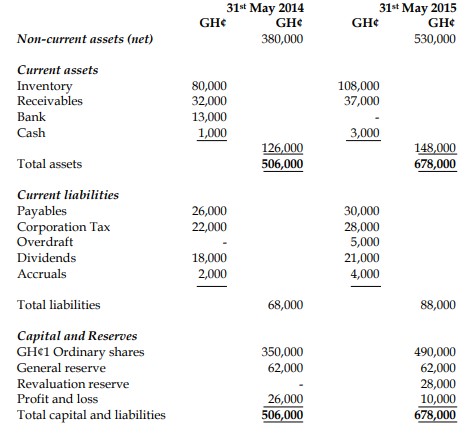
STATEMENT OF FINANCIAL POSITION
AS AT 31 MARCH:
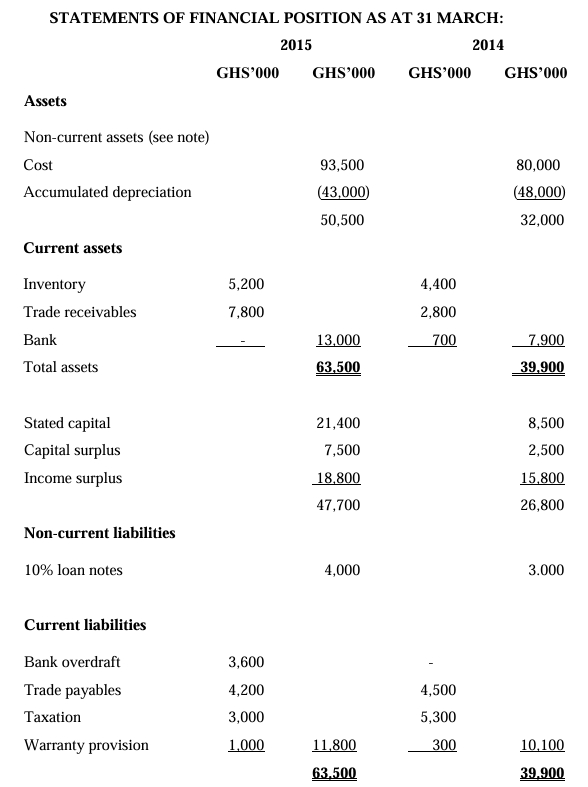
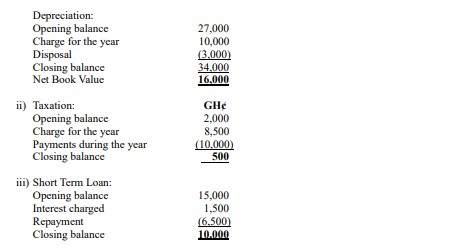
Note:
Non-current assets
During the year, the company redesigned its display areas in all of its outlets. The previous displays had cost GHS10 million and had been written down by GHS9 million. There was an unexpected cost of GHS500,000 for the removal and disposal of the old display areas. Also, during the year, the company revalued the carrying amount of its property upwards by GHS5 million, and the accumulated depreciation on these properties of GHS2 million was reset to zero.
All depreciation is charged to operating expenses.
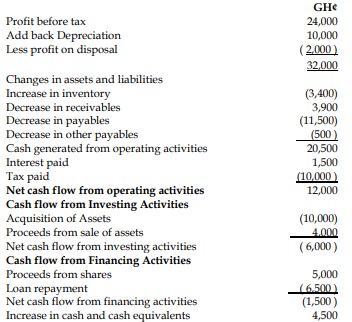
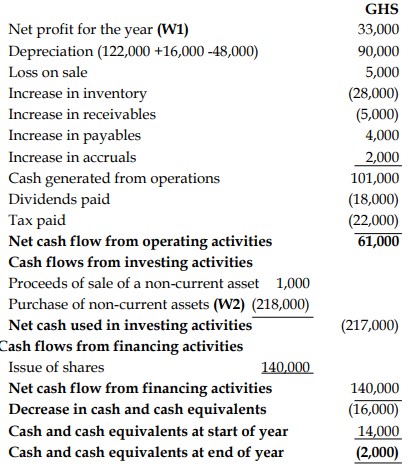
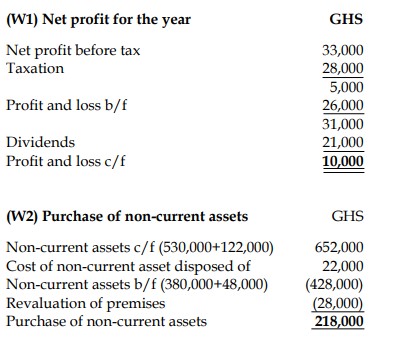
Required:
Prepare a statement of cash flows for CL Ltd for the year ended 31 March 2015 in accordance with IAS 7 – Statement of Cash Flows. (15 marks)
(b) The directors of CL Ltd are concerned at the deterioration in its bank balance and are surprised that the amount of gross profit has not increased for the year ended 31 March 2015. At the beginning of the current accounting period (i.e. on 1 April 2014), the company changed to importing its purchases from a foreign supplier because the trade prices quoted by the new supplier were consistently 10% below those of its previous supplier. However, the new supplier offered a shorter period of credit than the previous supplier (all purchases are on credit). In order to encourage higher sales, CL Ltd increased its credit period to its customers, and some of the cost savings (on trade purchases) were passed on to customers by reducing selling prices on both cash and credit sales by 5% across all products.
Required:
(i) Calculate the gross profit margin that you would have expected CL Ltd to achieve for the year ended 31 March 2015 based on the selling and purchase price changes described by the directors. (2 marks)
(ii) Comment on the directors’ surprise at the unchanged gross profit and suggest what other factors may have affected gross profit for the year ended 31 March 2015.
(3 marks)
(Total: 20 marks)