Question Tag: Cash Flow Analysis

Search 500 + past questions and counting.
Professional Bodies Filter
Program Filters
Subject Filters
More
Tags Filter
More
Check Box – Levels
Series Filter
More
Topics Filter
More

Evaluate with examples, the significance of each of the following to an analyst seeking to estimate the effect on future cash flows or liquidity of a company:
i) a commitment and a contingent liability. (2 marks)
ii) income in advance and a deposit (1.5 marks)
iii) an accrual and a provision (1.5 marks)

b) i) Commitment and contingent liability

A commitment to undertake a transaction should be backed by whether it is probable that future economic benefits will flow to/from the entity or that there is a virtual certainty of inflow/outflow of resources. Commitment usually have significant effect on the future cash flows or liquidity of an entity. For examine, if a bank issues a guarantee to its customers to purchase supplies, the bank must clearly understand that this can lead to liability which may require a provision to be made since it can affect the bank’s future cash flows.

A contingent liability does not have an immediate effect on the future cash flows of an entity unless there is certainty of an obligating event. A contingent liability such as a compensation that may be paid to a customer pending a legal suit for a suspected defective product should be disclosed unless the possible outflow of resources to meet the liability is remote. If the outflow of resources is thought to be remote, no disclosure is required. If is it probable that there is an obligating event which will lead to settlement of liability, then a provision should be made for the contingent liability.

ii) Income in advance and a deposit

Income in advance emanates from contractual agreements to provide goods and services at a future date. Income in advance and deposits received have effect on future cash flows because they are recognized as liabilities until the anticipated service is rendered/goods supplied. Deposits results in inflow of resources to the entity but income in advance do not necessarily lead to cash flows.

iii) Accruals and provisions

Accruals are current obligations of an entity that will result in outflow of economic benefits when the obligation is settled. Accruals therefore have significant effect on future cash flows or liquidity of an entity. Increases in accruals may lead to inflows of cash in the short term by freeing up available funds but eventually this will lead to outflow of cash to settle the increased accruals.

A provision is a liability of an uncertainty amount and timing. A provision is treated as a liability provided it can be measured reliably and it will lead to an outflow of economic benefits. Provisions do not affect the future cash flows of an entity unless an obligating event is triggered.

Mion Ltd is a listed company in Ghana and operates many super markets in Ghana. During the year 2014, there was speculation in the financial press that the entity was likely to be a takeover target for larger companies in Ghana. A recent newspaper publication has suggested that the directors are unlikely to resist a takeover. The seven member board are all nearing retirement and all own significant minority shareholdings in the business.

You have been approached by a private shareholder in Mion Ltd. She is concerned that the directors have conflict of interests and that financial statements for 2014 may have been manipulated. The income statement and summarized statement of changes in equity of Mion together with comparatives for the year ended 31st December 2014 and a statement of financial position as at that date are given below:

INCOME STATEMENT FOR THE YEAR ENDED 31ST DECEMBER 2014

The following additional information is relevant:

i) Non-current asset turnover (including both tangible and intangible non-current asset): 1.93 ii) Mion Ltd’s directors have undertaken a reassessment of useful lives of non-current tangible assets during the year. In most cases they estimate that the useful lives have increased and the depreciation charges in 2014 have been adjusted accordingly. iii) Six new stores have been opened during 2014, bringing the total to 42. iv) Three key ratios for the supermarket sector (based on the latest available financial statement of 12 listed entities in the sector) are as follows:

  • Annual sales per store: GH¢27.6m
  • Gross Profit margin: 5.9%
  • Net profit margin: 3.9%

Required:
Prepare a report and address to the investor, analyzing the performance and position of Mion Ltd based on the financial statements and supplementary information provided above. The report should also include comparisons with key sector ratios, and it should address the investor’s concerns about the possible manipulation of the 2014 financial statements. (15 marks)

REPORT To: A private shareholder
From: Management accountant
Date: 31/12/2014
Subject: Performance and position of Mion

As requested, I have analyzed the performance and position of Mion. My analysis is based on extracts from the financial statements for the year ended 31 December 2014 with comparative figures for the year ended 31 December 2013. A number of key measures have been calculated and these are set out in the attached Appendix.

SALES The company has opened six new stores during the year. However, sales have only increased very slightly in 2014 and annual sales per store have fallen. This may be because the new stores have only opened part way through the year and have therefore not contributed a full year’s revenue. Alternatively, there may have been an increase in the level of sales tax.

Annual sales per store are still above the industry average. On the face of it, this is a good sign. However, it is possible that Mion has large stores relative to the rest of the sector.

PROFITABILITY Gross profit margin has increased very slightly during the year and this is a little above the industry average. However, although net profit margin has increased significantly during the year, this is still below the industry average. The increase in net profit margin has occurred because operating expenses have fallen by over a quarter in 2014. The operating profit margin has risen from 3.8% in 2013 to 4.5% in 2014.

Given the information available, the mostly likely cause of this fall is the increase in asset lives and the resulting reduction in the depreciation expense. As might be expected, the company has a considerable investment in property, plant & equipment and depreciation would normally be significant expense. An increase in asset is relatively unusual and it is possible the directors have used this method to deliberately improve the operating and the net profit margins. (They may have been particularly concerned that the net profit margin has obviously been well below the industry average.)

On the other hand, the directors may have carried out their review of assets lives in good faith or there could be another legitimate reason why operating expenses have fallen. For example, the 2013 figure may have been inflated by a significant “one off” expense.

It is impossible to prove that the profit figure has been manipulated on the basis of the very limited information available. Information about the reasons for the fall in operating expenses and review of asset lives and about the property, plant & equipment held by the company would be extremely useful.

OTHER MATTERS Non-current asset turnover has improved slightly, but still below the industry average. This suggests that the company uses its asset less efficiently than others in the same sector. However, increasing the asset lives will have reduced the ratio for 2014; it is possible that the company’s asset turnover would have approached the sector average had the review not been carried out. Given that six new stores have opened in 2014, it is surprising that property, plant & equipment has only increased by GHS5 million in the year. It is possible that most of the investment in new property was made during 2013.

The current ratio for both years is extremely low. Supermarkets often do have relatively low current and quick ratios, but no average figure for the industry is available, so it is difficult to tell whether this is normal for the type of operation. Short-term liquidity appears not to be a problem because the company has a positive cash balance which has increased in the year. However, the appearance of the statement of financial position suggests that this has been achieved by delaying payment to suppliers. Trade and other payables have increased by nearly 9%, while revenue and cost of sales have only increased by approximately 3%.

The debt/ equity ratio has fallen in the year and gearing does not appear to be a problem.

CONCLUSION Mion’s profit margins appear to be reasonable for a company in its industry sector. Although its net profit margin is below the industry average, this is improving. There are no apparent short-term liquidity problems.

It is possible at least some of this improvement has been achieved by deliberately reducing the operating expenses for the year. If, as seems likely, the directors wish to sell their interest in the company in the near future, improved results will help to secure a better price.

However, it is impossible to be certain that this has happened without much more detailed information about the reason for the fall in operating expenses. There may be legitimate explanation for the improvement in the company’s profit margins.

APPENDIX

You are the Financial Consultant of Nkoso Funds, a pension fund in Ghana. Your company has identified two companies which you have been asked to evaluate as possible investments. The two companies, Trokaa Plc (Trokaa Plc) and Krokro Plc (Krokro Plc), are both publicly held and similar in size. Assume that all other publicly available information, including all climate, sustainability, and governance disclosures, have already been analysed and the decision concerning which company’s shares to acquire depends on their cash flow data given below:

Statement of cash flows for the years ended December 31, 2023 and 2022 Trokaa Plc Krokro Plc

Required:
a) Conduct a horizontal analysis for each of the two companies. (6 marks)

b) Write a report to the investment manager of Nkoso Funds discussing the relative strengths and weaknesses of each of the two companies. Conclude your report by recommending one company’s share as an investment avenue. (14 marks)

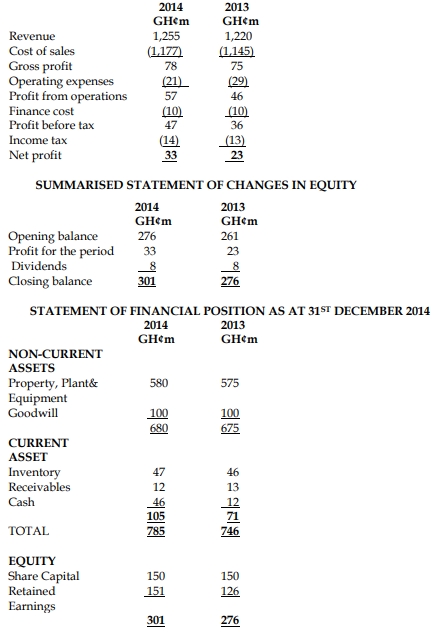
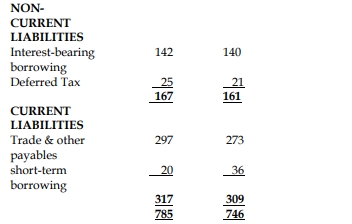
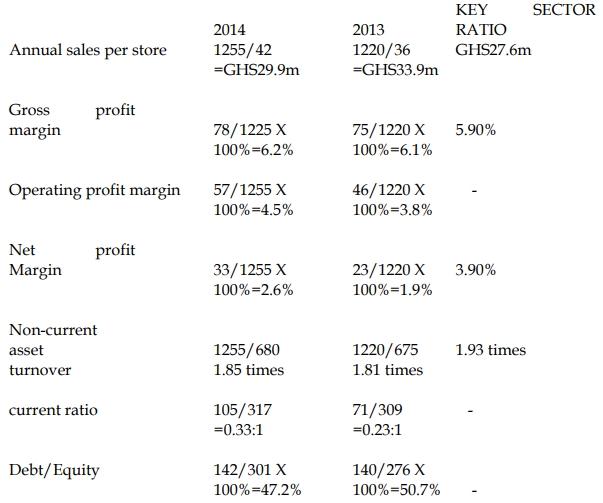
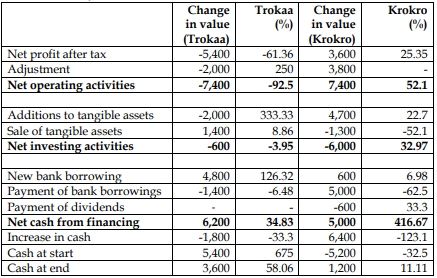
a) Horizontal Analysis

b) Report to the Investment Manager of Nkoso Funds

Report
To: Investment Manager, Nkoso Funds
From: Financial Consultant, Nkoso Funds
Date: xx/xx/xx
Subject: Relative cash flow analysis of Trokaa Plc and Krokro Plc

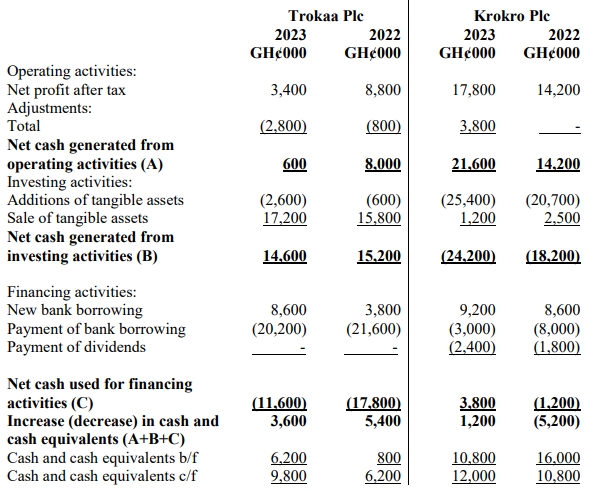
This report presents analysis of cash flow information of two companies: Trokaa Plc and Krokro Plc as part of a broad financial analysis carried out on these companies to decide which of them represents a better target to invest in. The analysis is undertaken under four different headings: cash flows from operating activities, cash flows from investing activities, cash flows from financing activities, and changes in cash and cash equivalents.

Cash flows from operating activities
From the cash flow statements, it is clear that both companies have remained profitable across the two years. However, while Trokaa Plc’s net profit has declined by 61.36% [(8800 – 3400)*100/8800] Krokro Plc’s profit has increased by 25.35% [(17800-14200)*100/14200]. This implies, albeit loosely, that Krokro’s profit figures are not only higher than those of Trokaa but also seem to be faring better over time.

The picture painted by the profit figures is same as what the net operating cash flows reveal. Both companies generated more cash than they spent on operations across both years. Trokaa’s net cash generated from operating activities decreased very significantly whereas Krokro matched the improved profitability with increased operating cash flows between the two periods.

A closer look at the numbers suggests that Trokaa’s poor cash management in 2023 did not result from only the reduced profitability but also from the increases in the negative adjustments. This most probably signifies a deterioration in net working capital management; more cash tied up in inventories and receivables. Another implication is that the poor current asset management has undone the impact of any addbacks of material non-cash expenses such as depreciation. In the case of Krokro, the nil adjustment indicates that 2022’s positive and negative adjustments may have cancelled each out. But in 2023 the adjustments represented an addition to profit to increase the operating cash flows. This may suggest a better working capital management and/or a simple addback of non-cash expenses.

Krokro Plc also appears to have had more quality profit than Trokaa Plc. In both years, Krokro Plc’s net operating cash flows exceeded the related net profits, indicating that the profit figures were not just an outcome of accounting gimmicks, but figures which are sufficiently backed by cash. On the contrary, Trokaa’s profits were higher than the related net operating cash flows in both years. For instance, in 2023, with operating cash flows sharply dropping, Trokaa’s profit was backed only 17.65% (600*100/3400) by operating cash flows for that year.

Cash flows from investing activities
Cash flows from investing activities are basically concerned with the acquisition and disposal of non-current assets and related items.

The cash flow statements reveal that Trokaa Plc has experienced net cash inflows from investing activities while Krokro Plc has recorded net cash outflows. This clearly indicates that Trokaa Plc is selling off and sizing down on its operations while Krokro Plc is investing long-term and expanding its activities.

Though the asset sales have generated material figures for Trokaa Plc across the two years, this action could raise going concern issue for the company unless there are plans to reinvest the proceeds in different ventures. Thus, these cash flows suggest that there are doubts about Trokaa’s future while Krokro Plc appears to be motivated by the good profit figures to be investing in new assets and creating even more positive outlook into the future.

The increased net investment activities by Krokro Plc however imply that free cash flows are negative in both years. The indication is that Krokro Plc did not fund the new acquisitions in both periods only with internally generated cash but also with funds from lenders as can be seen under financing activities. Conversely, Trokaa Plc’s increased divestment activities created positive free cash flows in both years.

Cash flows from financing activities
Cash flows from financing activities are concerned with activities which result in changes in an entity’s mix of equity and debt capital. These cash flows result from transactions between the entity on one hand and shareholders and lenders on the other.

Trokaa Plc reported net cash outflows from financing activities, albeit lower in 2023 than in 2022, across both years while Krokro Plc presented net cash outflows only in 2022. These figures show that Trokaa Plc spent the positive free cash flows (as discussed under investing) on capital holders while Krokro Plc rather had to raise additional monies (especially in 2023 when the net flows became positive) to finance its deficient free cash flows.

A closer look at the section breakdown shows that both entities obtained new funds from only lenders in both years. While at this point, it is apparently clear how the new borrowings by Krokro Plc were applied as discussed under investment activities, it is not for Trokaa Plc. However, the immediate next line shows that huge debt repayments were made by Trokaa Plc, compared to Krokro Plc. The proceeds from asset sales did not find their way into idle accounts or short-term investments for later use but were utilized to repay loans. This thus offers a confirmation that the company does not intend to invest in new projects or replace ones sold.

But then as a lot of repayments are occurring at Trokaa, its gearing position is expected to improve while future interest payments can be projected to fall. Krokro Plc’s loan build-ups in both years would worsen its gearing ratio and cause future interest payments to rise. However, it seems this does not create much concern as its strong profitability and operating cash flows should be able to allay any fears that lenders might harbour.

A more worrying picture painted by the 2023 figures of Trokaa is how the company has used the new loan. Instead of investing the loan proceeds in new assets, it appears Trokaa has used a good chunk to augment the asset sales to redeem the existing debts. This situation can easily push the company into debt distress as falling profitability coupled with failure to find and invest in new viable projects may impair the firm’s debt servicing capacity despite the improving gearing and lower future interest costs.

Only Krokro Plc paid dividends to shareholders in both years, with the 2023’s payment being one-third higher. Krokro Plc’s decisions to pay dividends and increase amount this year look very apt as the amounts in both years are sufficiently below the net cash generated from operating activities. The implication is that these payments can be sustained going forward. But the failure of Trokaa Plc to return anything to shareholders just adduces additional evidence of the apparent cash flow problems that its earlier numbers seem to be revealing.

Changes in cash and cash equivalents
Trokaa’s net cash changes have remained positive across the two periods even though the net cash increase of GH¢3.6 million in 2023 falls below what occurred in 2022 by 33 1/3 % [(5400 – 3600) * 100/5400].

These positive changes have been driven by cash generated from net asset disposals and net operating cash inflows, with the larger contributor being the former. Net cash from financing activities has been negative in both periods. But the reduction in net cash increment appears to have occurred largely because of the significant dip in net cash from operations (from GH¢8 million to GH¢0.6 million). This drop, combined with the small decrease in net investing inflows, was too huge to be compensated for by the significant decrease in the net cash used on financing activities.

The fact that Trokaa’s positive net cash changes are disproportionately dependent on proceeds from asset sales does not leave an all-that-good picture. In fact, without these inflows, the company would have net decreases in cash and cash equivalents. Meanwhile these flows are not sustainable as the firm cannot continue disposing of its assets to raise new funds. Else, it would be out of business.

It appears that Krokro’s cash flows situation gives a more encouraging picture than Trokaa’s. Krokro’s net cash changes improved from being a net negative figure last year to becoming a positive one this year. This improvement in net cash changes translates into an increment of GH¢6.4 million (GH¢1.2 million + GH¢5.2 m) from 2022 to 2023.

This improved performance was due to the significant rise in the net cash generated from both operating and financing activities. These huge increases led to the improvement we see because they exceeded how much more cash was required for the additional cash investments in 2023. Krokro’s turnaround appears even more impressive given that the firm generated much of the improvement from its own operating activities.

Overall, the cash flow data of the two companies suggest that not only has Krokro Plc been more profitable (in absolute terms, at least) across and over the two years but it has also handled and managed its cash flows better than Trokaa Plc. Krokro Plc has generated more cash from its own operations, is expanding its activities by buying new assets, is committed to sustainable dividend payments and is leveraging its strong potential to use a cheaper source of finance – debts – to fund its investments. I therefore recommend that we consider Krokro Plc for the share investment.

a) Agyasco Ltd, a software company has developed a new game “Lando” which it plans to launch in the near future. Sales volumes, production volumes and selling prices for “Lando” over its four-year life are expected to be as follows:

Financial information on “Lando” for the first year of production is as follows: Direct material cost GH¢5.4 per game Other variable production cost GH¢6.00 per game Fixed costs GH¢4.00 per game.

Advertising costs to simulate demand are expected to be GH¢650,000 in the first year of production and GH¢100,000 in the second year of production. No advertising costs are expected in the third and fourth years of production. Fixed costs represent incremental cash fixed production overheads. “Lando” will be produced on a new production machine costing GH¢800,000. Although this production machine is expected to have a useful life of up to 10 years, Government legislation allows Agyasco Ltd to claim the capital cost of the machine against the manufacture of a single product. Capital allowances will therefore be claimed on a straight-line basis over four years.

Agyasco Ltd pays tax on profit at a rate of 30% per annum and tax liabilities are settled in the year in which they arise. Agyasco Ltd uses an after-tax discount rate of 10% when appraising new capital investments. Ignore inflation.

Required: Calculate the net present value of the proposed investment and comment on your findings.

Workings

Fixed costs in year 1 = GH₵150,000 x 4 = GH₵ 600,000 and since these represent a one-off increase in fixed production overheads, these are the fixed costs in subsequent years as well.

Annual capital allowance (CA) tax benefits = (800,000/4) x 0.3 = GH₵60,000 per year.

(8 marks evenly spread using ticks)

Comment The net present value of GH₵65,200 is positive and the investment can therefore be recommended on financial grounds. However, it should be noted that the positive net present value depends heavily on sales in the first year. In fact, sensitivity analysis shows that a decrease of 5% in the first year sales will result in a zero net present value. (Note: you are not expected to conduct a sensitivity analysis)

(2 marks)