Question Tag: Breakeven Analysis

Search 500 + past questions and counting.
Professional Bodies Filter
Program Filters
Subject Filters
More
Tags Filter
More
Check Box – Levels
Series Filter
More
Topics Filter
More

a) Total production costs each week in a production department have been measured for the past five weeks, as follows:

Week Units Produced Total Cost (GH¢000)
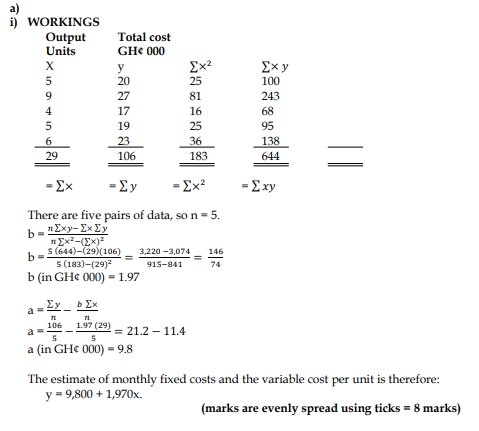
1 5 20
2 9 27
3 4 17
4 5 19
5 6 23

Required:
i) Use linear regression analysis to obtain an estimate of fixed costs per week and the variable cost of production per unit (see formula table). (8 marks)
ii) Use your results to estimate total costs in a week when 8 units are produced. (3 marks)
iii) Explain why the regression analysis method of separating cost is considered more accurate than the high-low method. (4 marks)

b) The cost-volume-profit (CVP) analysis, also commonly known as breakeven analysis, looks to determine the breakeven point for different sales volumes and cost structures, which can be useful for managers making short-term business decisions. For CVP analysis to be effective, several assumptions are usually made.

Required:
State FOUR (4) assumptions underlying cost-volume-profit (CVP) analysis. (5 marks)

iii) Explanation:
Regression analysis is more accurate than the high-low method because the regression equation estimates costs using information from ALL observations, whereas the high-low method uses only TWO observations. This method measures the difference between actual cost and estimated cost for each observation.
(4 marks)

b) Assumptions underlying breakeven (CVP) analysis:

  • Cost can be classified into fixed and variable elements only.
  • Variable cost may vary proportionately with the level of activity attained.
  • Activity is the only factor that drives cost of production.
  • Selling price of the product remains constant.
  • Stock levels do not change with activity level.
  • Level of technology remains constant.
    (Any 4 points @ 1.25 marks each = 5 marks)


a) Cost-Volume-Profit (CVP) analysis is a way to find out how changes in variable and fixed costs affect a firm’s profit. Companies can use CVP to assess the impact on profit taking into consideration some assumptions.

Required:
State FIVE (5) assumptions underlying Cost-Volume-Profit Analysis. (5 marks)

b) The following data has been extracted from the operating records of Sharp Production Ltd:

Year Costs (GH¢) Profit (GH¢)
2019 402,000 54,000
2020 510,000 90,000

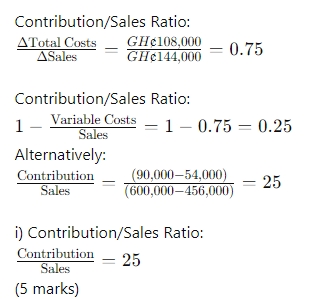
Required: i) Calculate the contribution/sales ratio for the company. (5 marks) ii) Compute the total fixed costs per annum. (5 marks) iii) Compute the sales value required to breakeven. (5 marks)


a) Assumptions underlying CVP Analysis:

  1. All costs can be conveniently segregated into fixed and variable elements.
  2. Total fixed costs remain constant while variable costs vary proportionately with the level of activity.
  3. The selling price per unit is given and remains constant over the relevant range of activity.
  4. All that is produced can be sold at the prevailing price.
  5. The only factor affecting costs and revenues is the volume of activity.
  6. Technology, production methods, and efficiency remain unchanged.
  7. There are no inventory level changes, or inventories are valued at marginal cost.
  8. There is no uncertainty.
  9. A single product or a constant product mix is produced and sold. (Any 5 points @ 1 mark each = 5 marks)

b) Workings:

Year Cost (GH¢) Profit (GH¢) Revenue (GH¢)
2019 402,000 54,000 456,000
2020 510,000 90,000 600,000
Revenue Cost
High 600,000
Low 456,000
Change 144,000


ii) Computation of Total Fixed Costs:

Year Revenue (GH¢) TC (GH¢) TVC (GH¢) TFC (GH¢)
2019 456,000 402,000 342,000 60,000
2020 600,000 510,000 450,000 60,000

Alternatively: Using higher sales level: Contribution = 0.25 x GH¢600,000 = GH¢150,000 Profit = contribution – FC GH¢90,000 = GH¢150,000 – FC This implies FC = GH¢60,000 (5 marks)